| |
|
|
| |
|
 |
Textauszug
aus:
IPCC Report Climate Change 2007: The Physical Science Basis
- Summary for Policymakers: |
 |
| |
|
|
| |
|
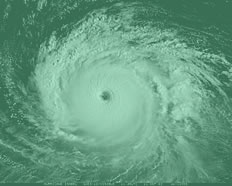
“There
is observational evidence for an increase in intense tropical
cyclone activity in the North Atlantic since about 1970, correlated
with increases of tropical sea surface temperatures. There are
also suggestions of increased intense tropical cyclone activity
in some other regions where concerns over data quality are greater.
Multi-decadal variability and the quality of the tropical cyclone
records prior to routine satellite observations in about 1970
complicate the detection of long-term trends in tropical cyclone
activity. There is no clear trend in the
annual numbers of tropical cyclones.” |
|
 Abb.
A2-32/01:
Abb.
A2-32/01:
By Courtesy of Earth System
Science Center, Hurricane Isabel 1963 |
|
|
|
|
 |
Offizielle
Statistik des National Hurricane Center, NOAA |
|
|
 |
|
Bitte
beachten Sie, dass die folgende Tabelle des  National Hurricane Center, NOAA (National Oceanic
& Atmospheric Administration, U.S. Department of Commerce)
[date of access: 03.06.2007] nur jene Hurrikane berücksichtigt,
welche von Bedeutung für die Landfläche der USA
waren (landfalling hurricanes).
National Hurricane Center, NOAA (National Oceanic
& Atmospheric Administration, U.S. Department of Commerce)
[date of access: 03.06.2007] nur jene Hurrikane berücksichtigt,
welche von Bedeutung für die Landfläche der USA
waren (landfalling hurricanes).
Die nicht
unerhebliche Zahl der östlich und südöstlich
der Küste der USA über den Atlantik ziehenden Wirbelstürme
wurden in dieser Tabelle nicht erfasst (vgl. dazu die
vollständige
Liste aller Hurrikane - incl. Major Hurricanes - von 1851
bis 2006 bzw. die Grafiken
weiter unten!).
2006
erreichte kein Hurrikan der Stärke 3+ das Festland
der USA, wogegen fünf Hurrikane dieser Kategorie östlich
über den Atlantik zogen (lt. Grafik auf Seite 16 der
unten genannten Publikation in SdW
06/2007).
|
| |
| |
|
 Tab. A2-32/01:
"Number
of hurricanes by Saffir-Simpson
Category to strike the mainland U.S. each decade
(Only
the highest Saffir-Simpson Category to affect the U.S. has
been used).
|
| |
|
|
|
|
|
|
|
|
| Decade |
Saffir-Simpson
Category |
All
1, 2, 3, 4, 5 |
Major
3, 4, 5 |
| 1 |
2 |
3 |
4 |
5 |
| 1851-1860 |
8
|
5 |
5 |
1 |
0 |
19 |
6 |
| 1861-1870 |
8 |
6 |
1 |
0 |
0 |
15 |
1 |
| 1871-1880 |
7 |
6 |
7 |
0 |
0 |
20 |
7 |
| 1881-1890 |
8 |
9 |
4 |
1 |
0 |
22 |
5 |
| 1891-1900 |
8 |
5 |
5 |
3 |
0 |
21 |
8 |
| 1901-1910 |
10 |
4 |
4 |
0 |
0 |
18 |
4 |
| 1911-1920 |
10 |
4 |
4 |
3 |
0 |
21 |
7 |
| 1921-1930 |
5 |
3 |
3 |
2 |
0 |
13 |
5 |
| 1931-1940 |
4 |
7 |
6 |
1 |
1 |
19 |
8 |
| 1941-1950 |
8 |
6 |
9 |
1 |
0 |
24 |
10 |
| 1951-1960 |
8 |
1 |
5 |
3 |
0 |
17 |
8 |
| 1961-1970 |
3 |
5 |
4 |
1 |
1 |
14 |
6 |
| 1971-1980 |
6 |
2 |
4 |
0 |
0 |
12 |
4 |
| 1981-1990 |
9 |
1 |
4 |
1 |
0 |
15 |
5 |
| 1991-2000 |
3 |
6 |
4 |
0 |
1 |
14 |
5 |
| 2001-2006
* |
6 |
2 |
6 |
1 |
0 |
15 |
7 |
|
|
|
| 1851-2006
* |
110 |
73 |
75 |
18 |
3 |
279 |
96 |
Average
per
Decade * |
7.1 |
4.7 |
4.8 |
1.2 |
0.2 |
17.9 |
6.2 |
|
| |
|
|
Orig.
Tab. aus: U.S. Hurricane Strikes by Decade - übertragen
von der Website NOAA/
National Weather Service, leicht verändert und ergänzt
aus Publikation  Blake,
Eric S., Edward N. Rappaport & Chr. Landsea (2007) - NOAA
Technical Memorandum NWS TPC-5 Blake,
Eric S., Edward N. Rappaport & Chr. Landsea (2007) - NOAA
Technical Memorandum NWS TPC-5  [2.800
KB]
[2.800
KB] |
| |
|
 Vgl.
auch: Vgl.
auch:
NOAA Technical Memorandum NWS TPC-5: The Deadliest,
Costliest, and most intense United States Hurrricanes from
1851 to 2006 - updated 2007 (and other frequently requested
hurricane facts), from NOAA - NWS - Tropical Prediction Center,
Miami, Florida, and
Dr.
Christopher Landsea,,
NOAA/AOML/Hurricane Research Division, Miami, Florida
(Dr.
Cristopher Landsea hat sich erst kürzlich unter Protest
aus dem Autoren-Team des IPCC zurück gezogen)
 Full
Report of NOAA Technical Memorandum NWS TPC-5:
etc., available inPDF
or MS-Word
format. Full
Report of NOAA Technical Memorandum NWS TPC-5:
etc., available inPDF
or MS-Word
format.
|
| |
|
Anmerkung:
Hier muss noch einmal ausdrücklich darauf hingewiesen
werden, dass die Tabelle oben (Tab. 1) ausschliesslich die
für das Festland der USA relevanten Hurrikane aufführt.
Durchschnittlich (mit extrem grossen Schwankungsbreiten)
etwa ein Drittel aller starken Hurrikane (3+) über
dem Atlantik erreicht auch das Festland der USA. Bezogen
auf 10-Jahres-Zeiträume ist hier ein leichter Rückgang
starker Hurrikane (3+) zu verzeichnen, auch wenn die Schäden
immens zugenommen haben (Zu den Ursachen vgl. unten die
"Conclusions" des o.g. Artikels von Blake,
Rappaport & Landsea (2007) sowie Textauszug
des Statements einer Gruppe von Hurrikanforschern.
|
| |
| |
|
Tropische
Zyklone über dem Nord-Atlantik: |
|
|
|
Bzgl.
Hurrikane muss zur Kenntnis genommen werden, dass es bisher
keinen statistischen Befund für eine Zunahme der Häufigkeit
oder Stärke von Hurrikanen in den letzten 150 Jahren,
d.h. von 1851 bis 2004 im Bereich des Nord-Atlantiks gibt,
welche von Bedeutung für das U.S.-Amerikanische Festland
waren.
Das Gegenteil
ist richtig, trotz kontinuierlicher Erwärmung seit dem
Ende der sogenannten "Kleinen
Eiszeit" (Klimapessimum) ab etwa 1850, d.h. einem
leichten globalen Oberflächen-Temperaturanstieg von 0.6
±0.2 K in den letzten 150 Jahren.
Eine
Ausnahme bilden jedoch aktuell einzelne Jahre, z.B. 2004 und
2005. In 2005 wurde die bisher höchste Zahl von Hurrikanen
registriert. Bereits im folgenden Jahr 2006 war deren Häufigkeit
jedoch weit unterdurchschnittlich. Generell sagen einzelne
Jahre überhaupt nichts aus über Klimaentwicklungen.
Dafür sind Daten von wenigstens 30 Jahre notwendig.
Wird
das langjährige Mittel aller tropischen Zyklone über
dem Nordatlantik betrachtet, so kommt es auf den gewählten
Zeitabschnitt an. Die Tabelle unten (Tab. 2 bzw. Table 7 aus
Blake,
Eric S., Edward N. Rappaport & Chr. Landsea (2007) - NOAA
Technical Memorandum NWS TPC-5 )
zeigt für den relativ kurzen Zeitraum von 10 Jahren von
1997 bis 2006 eine überdurchschnittliche Anzahl schwerer
Hurrikane, wogegen für längere Zeiträume der
Durchschnittswert bei 2.5 liegt (und nicht bei 2 wie in Tab.
3 angegeben).
Bei dem
Wert von 1.8 für den Zeitraum von 1851-2006 muss berücksichtigt
werden, dass laut Blake et al.(2007) für die Zeit vor
1900 nur unvollständige Statistiken vorliegen. Ausserdem
ist bzgl. höherer Werte ab 1966 die Einbeziehung subtropischer
Stürme ab 1967 in diese Statistik zu bedenken sowie eine
wesentliche bessere Erfassung von Wirbelstürmen mit Hilfe
geostationärer Satelliten. Vgl. Statement
on Tropical Cyclones and Climate Change ,
247 KB, 13S. (November
2006) [date
of access: 04.06.2007]
Ein
Vergleich des 10-Jahres-Zeitraums von 1997-2006 in Tab. 2
mit einem Durchschnittswert schwerer Hurrikane von
3.6 mit den Angaben in Tab. 3 zeigt, dass die
Anzahl der Hurrikane der Kategorie 3+ vor 2004 drastisch unter
dem Durchschnittswert gelegen muss. Verglichen mit dem Durchschnittswert
von 2.5 für den Zeitraum von 1950-2000 erscheint
der Wert von 3.6 sehr hoch zu sein. Für den 10-Jahres-Zeitraum
von 1950-1959 lag er aber z.B. bei 3.9. Und geht man
davon aus, dass durchschnittlich in den nächsten Jahren
die Hurrikan-Häufigkeit gleich hoch bleibt, dann kann
wohl für den Zeitabschnitt von 2000-2009 wieder mit einem
ähnlichen Wert wie 1950-1959 gerechnet werden. Betrachtet
man noch einmal den Zeitraum von 1950-2000 im Hinblick auf
Perioden geringer Häufigkeit schwerer Hurrikane, dann
fällt vor allem eine extrem hurrikanarme Zeitspanne zwischen
1965-1994 auf, in welcher schwere Hurrikane nur weit unterschnittlich
auftraten und zwar mit einer Häufigkeit von 1.6.
Eine direkte Beziehung zu den global steigenden Temperaturen
ist in Bezug auf schwere Hurrikane der Kategorie 3+ kaum herzustellen.
Vgl. dazu den Abschnitt 21 (siehe
unten!) des Statement
on Tropical Cyclones and Climate Change ,
247 KB, 13S. (November
2006) [date
of access: 04.06.2007]
|
|
|
|
|
|
Hier
(unten) die
vollständige
Liste aller Hurrikane (incl. Major Hurricanes) von 1851 bis
2006, zusammengestellt von Christopher Landsea, National
Hurricane Center (NOAA, USA). Eine weitere Liste wurde entwickelt
von Paul
Linsay und zwar auf der Basis der Landsea-Auswertungen.
Landsea kommt übrigens in der hier genannten Auswertung
auf einen jährlichen Durchschnittswert von 6.1
Hurrikanen insgesamt und von 2.3 Hurrikanen der Kategorie
3+ für den Zeitraum von 1965 bis 2006. Damit liegt dieser
Wert unter dem für den Zeitabschnitt von 1950-2000 mit
2.5 Hurrikanen der Kategorie 3+.
|
|
|
| |
|
Tab. A2-32/02:
"... Average number of tropical
cyclones* which reached storm, hurricane and major hurricane
status. Updated from Blake et. al. (2005)" inBlake,
Rappaport & Landsea, 2007) |
| |
|
|
| |
|
|
"CONCLUSIONS:
In virtually every coastal city from Texas to Maine, the present National
Hurricane Center Director (Bill Proenza) and former directors
have stated that the United States is building toward its next
hurricane disaster. Hurricane
Katrina is a sad reminder of the vulnerability of the United
States to hurricanes.
The areas along the United States Gulf and Atlantic coasts where most
of this countrys hurricane related fatalities have occurred
are also experiencing the countrys most significant growth
in population. Low hurricane experience levels, as shown by
Hebert et al. (1984), Jarrell et al. (1992) and Table 12,
are a serious problem and could lead to future disasters.
This situation, in combination with continued building along
the coast, will lead to dangerous problems for many areas
in hurricanes. Because it is likely that people will always
be attracted to live along the shoreline, a solution to the
problem lies in education and preparedness as well as long-term
policy and planning.
The message to coastal residents is this: Become familiar with what
hurricanes can do, and when a hurricane threatens your area,
increase your chances of survival by moving away from the
water until the hurricane has passed!
Unless this message is clearly understood by coastal
residents through a thorough and continuing preparedness effort,
disastrous loss of life is inevitable in the future."
(aus
Blake,
Rappaport & Landsea, 2007)
|
|
| |
 |
| |
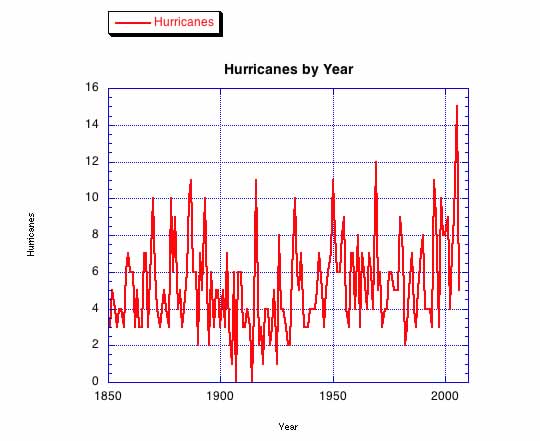
Abb.
A2-32/02: Hurricanes by year.
|
| |
 |
| |
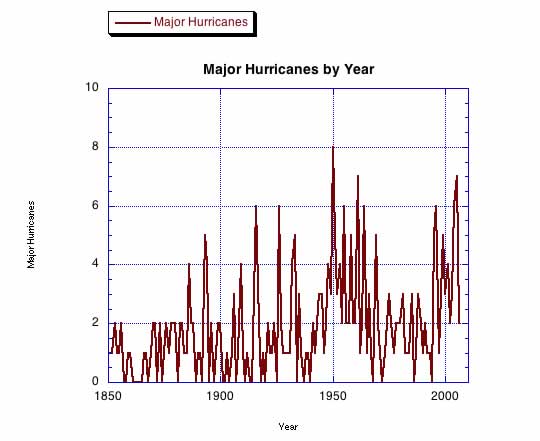
Abb.
A2-32/03: Major hurricanes by year.
|
| |
| |
Quelle
der Abbildungen oben:
Christopher
Landsea, National Hurricane Center, Hurrican Research Division:
"How many tropical cyclones have there been each year
in the Atlantic basin? What years were the greatest and
fewest seen?"
|
| |
| |
|
| |
| |
|
Tab. A2-32/03:
Kombinierte Tabelle mit Angaben u.a.
zu tropischen Stürmen, Hurrikanen (nach Saffir-Simpson-Kategorien,
siehe oben!) und den Anomalien der Oberflächentemperatur
im Ostpazifik etc. Hier von Bedeutung sind die hervorgehobenen
Zeilen zur Hurrikanhäufigkeit.
|
|
|
|
|
|
|
|
| Sturmsaison |
1950-2000
langjähriges Mittel |
2004 |
2005 |
2006 |
1997
extremer
El Niño |
1955
extreme
El Niña |
tropische
Strürme
(Vorhersage Ende Mai) |
9,6 |
15
(14) |
28
(15) |
10
(17) |
8 |
12 |
Hurrikane
(Vorhersage) |
5,9 |
8
*1
(8) |
15
(8) |
5
(9) |
3 |
9 |
starke
Hurrikane (Kategorie 3+)
(Vorhersage) |
2
*2 |
6
(3) |
7
(4) |
2
(5) |
1 |
6 |
summierte
Sturmenergie in
10.000 Quadratknoten |
87,5
(Median) |
224,9 |
248,9 |
78,5 |
40,1 |
199,0 |
Anomalie
der Oberflächentemperatur
im Ostpazifik in Grad Celius |
0 |
+0.9 |
-0,7 |
+1.1 |
+2,5 |
-2,1 |
| offizielle
Todesfälle |
|
±
3.321 |
±
2.280 |
17 |
11 |
±
1.518 |
| Schäden
in Milliarden Dollar |
|
44,9 |
124 |
0,5 |
0,13 |
8,2 |
|
|
*1 Nach
NOAA,
NHC waren es 2004 insgesamt 9 Hurrikane |
|
*2
Nach
Landsea
lag das langjährige Mittel für starke Hurrikane (Kategorie
3+) von 1950-2000 bei 2.5 |
| |
|
Quelle:
Nach Thomas Langkamp
(2007): Wirbelstürme,
war es 2006 zu windig - Die Rekord-Hurrikansaison 2005 schien
zu den Warnungen zu passen, dass der Klimawandel Stürme
und Unwetter verstärkt. Doch 2006 hielt der Trend nicht
an: Es gab nur fünf Hurrikane statt fünfzehn wie
im Jahre davor. Warum? - Spektrum der Wissenschaft, Juni 2007:
16-20. (Tabelle leicht verändert!)
|
|
|
|
|
|
Eine
stetige Zunahme von schweren Wirbelstürmen innerhalb
der letzten 35 Jahre wird verschiedentlich für den Pazifischen
Ozean (hier Zyklone bzw. Taifune genannt) behauptet, jedoch
von NOAA nicht bestätigt:
"For
the Northeast Pacific, the records stand at maximums of
27 tropical storms / hurricanes in 1992 and 16 hurricanes
in 1990. Reliable records go back in this basin to around
1966 when geostationary satellite coverage began. For the
Northwest Pacific, the peak year stands at 1964 with 39
tropical storms, 26 of which became typhoons. Reliable records
for this basin begin around 1960."
Vgl.
Record
number of storms by basin [date
of access: 23.09.05]
|
|
|
|
|
|
Bzgl.
Schäden durch Hurrikane vgl. die folgenden Textauszüge:
|
|
|
| |
|
Blake,
Rappaport & Landsea (2007: 8)
"The
study by Jarrell et al. (1992) used 1990 census data to show
that 85% of U.S. coastal residents from Texas to Maine had
never experienced a direct hit by a major hurricane.
This risk is higher today as an estimated 50 million residents
have moved to coastal sections during the past twenty-five
years. The experience gained through the landfall
of 7 major hurricanes during the past 3 years has not lessened
an ever-growing concern brought by the continued increase
in coastal populations." (Hervorh.
durch den Autor)
Statement
on Tropical Cyclones and Climate Change ,
247 KB, 13S. (November
2006) [date
of access: 04.06.2007]
Weitere Angaben zu diesem Statement weiter unten!
|
| |
 |
| |
|
| |
|
Weiterführende
Informationen: |
|
|
| |
|
Donnelly,
Jeffrey P. & Jonathan D. Woodruff
(2007) Intense
hurricane activity over the past 5,000 years controlled
by El Niño and the West African monsoon.-
Nature 447, 465-468 (24 May 2007) [date
of access: 05.06.2007]
Abstract
(adopted from NATURE):
"The processes that control the formation,
intensity and track of hurricanes are poorly understood.
It has been proposed that
an increase in sea surface temperatures caused by
anthropogenic climate change has led to an increase
in the frequency of intense tropical cyclones, but
this proposal has been challenged on the basis that
the instrumental record is too short and unreliable
to reveal trends in intense tropical cyclone activity.
Storm-induced deposits preserved in the sediments
of coastal lagoons offer the opportunity to study
the links between climatic conditions and hurricane
activity on longer timescales, because they provide
centennial- to millennial-scale records of past
hurricane landfalls. Here we present a record of
intense hurricane activity in the western North
Atlantic Ocean over the past 5,000 years based on
sediment cores from a Caribbean lagoon that contain
coarse-grained deposits associated with intense
hurricane landfalls. The record indicates that the
frequency of intense hurricane landfalls has varied
on centennial to millennial scales over this interval.
Comparison of the sediment record with palaeo-climate
records indicates that this variability was probably
modulated by atmospheric dynamics associated with
variations in the El Niño/Southern Oscillation
and the strength of the West African monsoon, and
suggests that sea surface temperatures as high as
at present are not necessary to support intervals
of frequent intense hurricanes. To accurately predict
changes in intense hurricane activity, it is therefore
important to understand how the El Niño/Southern
Oscillation and the West African monsoon will
respond to future climate change."
Artikel dazu in Spiegel-Online
|
| |
|
|
| |
|
Zur
Bedeutung von "El
Niño - Southern Oscillation (ENSO)"
siehe auch Hier,Hier
und Hier!
|
| |
|
|
| |
|
Emanuel,
K., R. Sundararajan, J. Williams (2008)
Hurricanes
and Global Warming - Results from Downscaling IPCC AR4
Simulations.- ,
[20 S.] American Meteorological Society,
347-367 (March 2008). [last
date of access: 29.12.2019]
Die
o.g. Verfasser diskutieren hier die Abhängigkeit
von Global Warming und Hurrikan-Häufigkeit. Vgl.
Sie dazu auch Climate
Audit und eine Pressemitteilung
des MIT von David Chandler, MIT News Office, als
Reaktion auf die 'peer reviewed' - Publikation von
Emanuel et al. (2008).
|
| |
|
|
| |
|
Emanuel,
K., (2006) Anthropogenic
Effects on Tropical Cyclone Activity
- I.
Frequently Asked Questions about Global Warming and Hurricanes,
Part
II: Essay. |
| |
|
|
| |
|
Emanuel,
Kerry - Homepage - mit
vielen Publikationen und weitere Infos. |
| |
|
|
| |
|
Landsea,
C.W. et al. (1996)Downward
trends in the frequency of intense Atlantic hurricanes
during the past five decades.- Geophysical Research
Letters, 23, 1697-1700. [date
of access: 07.11.06] |
| |
|
|
| |
|
Michaels,
Patrick (2005) Global
Warming and Hurricanes: Still no Connection.
[website offline] |
| |
|
|
| |
|
Michaels,
Patrick (2005) Global
Warming Blows - Or Does It? There's no shame in good hurricane
science. [website offline] |
| |
|
|
| |
|
Rappaport,
Edward N. & Jose Fernandez-Partagas (1995) The
Deadliest Atlantic Tropical Cyclones, 1492-1996. -
28 May 1995 - NOAA Technical Memorandum NWS NHC 47, updated
22 April 1997 by Beven, Jack . [date
of access: 04.06.2007] |
| |
|
|
| |
|
McBride
et al. (2006) Statement
on Tropical Cyclones and Climate Change ,
247 KB, 13S.
[date
of access: 04.06.2007] Liste der Verfasser
siehe unten!
This
statement was authorized by participants of the
WMO International Workshop on Tropical Cyclones,
IWTC-6, San Jose, Costa Rica, November 2006. This
resulted from discussion and review through the two
weeks of the workshop. The process was overseen by
WMO Tropical Meteorology Research Programme TMRP Committee
TC2: Impact of Climate Change on Tropical Cyclones.
Membership:
John
McBride (Australia, Committee Chair); Kerry
Emanuel, Thomas Knutson, Chris
Landsea, Greg Holland, Hugh Willoughby (USA);
Johnny Chan, C.-Y. Lam (Hong Kong, China); Julian
Heming (United Kingdom), Jeff Kepert (Australia).
Purpose
of the statement:
To
provide an updated assessment of the current state
of knowledge of the impact of anthropogenically induced
climate change on tropical cyclones. ...
Sehr
zu empfehlen!
|
| |
|
|
|
|
Textausschnitt
aus dem o.g. Artikel:
(Lit.-Angaben siehe Artikel - hier auch eine umfangreiche
Liste der aktuellen und diskutierten Literatur)
|
| |
|
|
| |
 |
| |
|
|
| |
|
Trenberth,
Kevin E. (2007)
Wärmere
Meere - stärkere Hurrikane.-
SdW, September 2007, S. 34-41.
"Alles
deutet darauf hin, dass sich durch die globale Erwärmung
die Zerstörungsgewalt tropischer Wirbelstürme
erhöht. Sowohl die Windstärke als auch die
Niederschlagsmengen werden in bedrohlicherweise zunehmen."
Dr.
Trenberth hat als "koordinierender Leitautor
zum Sachstandsbericht des UN-Klimarats (IPCC) aus
diesem Jahr beigetragen" (SdW 2007/09, S.
41).
Der
reisserische Charakter des Artikels wird auf S.35
deutlich, wo ein Hurrikan in einer Collage abgebildet
ist, der die Grösse Nordamerikas hat. Auf der
folgenden Seite heisst es in einer Überschrift
suggestiv "Der Mensch ist schuld".
In dem Artikel finden sich zahlreiche Falschaussagen
und unhaltbare Bemerkungen, welche nur erklärt
werden können vor dem Hintergrund der von Landsea
geäusserten Skepsis.
 Anmerkung:
Die Seriosität dieses Artikels können Sie
selbst überprüfen, in dem Sie sich die offiziellen
Statistiken und Interpretationen von NOAA
NCDC: Climate of 2004 - Atlantic Hurricane Season,
oder auch einfach die Tabelle
1 auf dieser Seite anschauen.
Textauszug:
"Impacts of 2004 Season: Nine tropical systems
affected the US during 2004. The estimated cost
of damage to the US from hurricanes and tropical
storms in 2004 is over $42 billion. This is the
most costly hurricane season ever for the US, with
the second most costly, at $35 billion, being 1992,
the year that Hurricane Andrew impacted Florida.
Five
hurricanes made landfall in the US with Hurricane
Alex also impacting North Carolina without officially
making landfall. The record number of landfalling
hurricanes in a season is 6 and this occurred in
both 1916 and 1985. 2004 shares second place with
1933. An unprecented 4 hurricanes (Charley, Frances,
Ivan and Jeanne) affected Florida this year, indeed
no other state has been affected by four hurricanes
in one season since Texas in 1886. An estimated
one in five homes in Florida were damaged by hurricanes
during August and September 2004 and 117 people
lost their lives in the state from the storms."
Abgesehen
von dem Umstand, dass in dem o.g. Artikel manipulative
Falschaussagen (das hätte der Redaktion von SDW
auffallen müssen!!) zum anthropogenen Temperaturanstieg
stehen (z.B. Abb. 1 und 2 auf S.38, was schon unerträglich
ist), ist es zusätzlich interessant, sich die
hochumstrittenen Thesen, aber auch Wissenschaft von
Trenberth in den ausführlichen Anmerkungen in
World
Climate Report (WCR) "A Man on a
Mission" [Kommentarr und
Textauszug mittlerweile offline] anzuschauen.
Textauszug:
"The fact that Trenberth admits to be on
a mission to try “to get people to think about
things in a different fashion…[that] all meteorological
events around the world are influenced in some way
by global warming” is precisely the reason
that Landsea quit the IPCC. Obviously Trenberth
has an agenda, and it is one that lies outside of
the current state of our best science."
Bemerkungen
zu WCR
in Wikipedia
[ Hinweis] Hinweis]
Zu
den Statistik-Kenntnissen von Trenberth schreibt Steve
McIntire (welcher Statistik-Fehler in MBH98
sowie in den Aussagen zur Temperaturentwicklung durch
NASA GHCN aufdeckte) am 5. Jan. 2005 unter der Überschrift
"Trenberth
on Statistics":
Textauszug:
"It’s too bad that so many climate
scientists, who hold themselves out as authorities,
actually have such sketchy knowledge of statistics
and that, despite this, have generally failed to
involve statistical professionals in their work."
|
| |
|
|
Wu,
Y., S. Wu, and P. Zhai. (2007)
The
impact of tropical cyclones on Hainan Island’s
extreme and total precipitation.-
International Journal of Climatology,
DOI: 10.1002/joc.1464. Besprechung des Artikels
von World Climate Report unter dem Titel: Tropical Cyclones
Decreasing in China?
Zitat:
"We
have reported similar findings from throughout the
world, but as the 2007 hurricane gets started, we
will surely be bombarded with the message that global
warming is causing more hurricanes worldwide - yet
historical evidence proves otherwise."
|
| |
|
|
| |
 |
| |
|
Copyright
© Harald Kehl
ehemals TU-Berlin - Institut für Ökologie
|
| |


|
| |
|
|
|
| |
| |
| |
|
|
|