| |
|
|
 |
| |
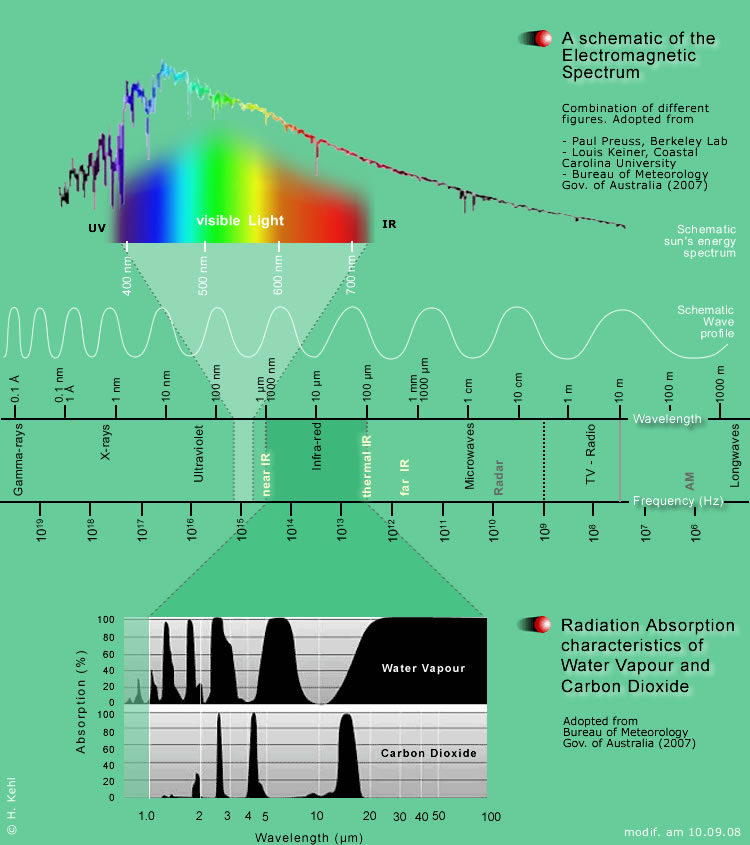
 Abb. A2-37/01:
Schema des elektromagnetischen
Spektrums ("A schematic of the Electromagnetic
Spectrum") mit der Leistung der Sonnenenergie
in Beziehung zu den Wellenlängen. Im unteren Teil der
Abbildung ausserdem Charakteristiken der Strahlungsabsorption
für Wasserdampf und Kohlenstoffdioxid. ("Radiation
Absorption characteristics of Water Vapour and Carbon Dioxide").
Spektralbereiche von kurzwelliger bis langwelliger Strahlung.
Verändert
nach
 “The
Greenhouse Effect and Climate Change” “The
Greenhouse Effect and Climate Change”
Geoscience
Australia, by Chris Hepplewhite: "A
schematic of the electromagnetic spectrum, showing the Sun's
energy output in relation to wavelength"
 Anmerkung:
Diese allzu schematische - und dadurch missverständliche
- Kurve wurde am 10.09.08 ersetzt aus: Anmerkung:
Diese allzu schematische - und dadurch missverständliche
- Kurve wurde am 10.09.08 ersetzt aus:
"Plasma
Redshift and the Astrophysics of the Non-Exploding Universe"
(Fig.: Solar disk center intensity) nach:
Burlov-Vasiljev
K.A., Gurtovenko E.A., Matvejev Yu.B. (1995) New absolute
measurements of the solar spectrum 310–685 nm.- Solar
Phys. 15: 51-73.
Burlov-Vasiljev K.A., Matvejev Yu.B., Vasiljeva I.E. (1998)
New Measurements of the Solar Disk-center Spectral Intensity
in the Near IR from 645 nm to 1070 nm.- Solar Phys.
177: 25-40.
aus: http://www.mao.kiev.ua/sol_ukr/terskol/ters_all.html
"An
unexpected discovery could yield a full spectrum solar cell"
by Paul Preuss, Berkeley Lab.
"Physical
Oceanography Animations" by Louis E. Keiner, Coastal
Carolina University, Marine Science,
“The
Greenhouse Effect and Climate Change”: "The
radiation Absorption characteristics of Water Vapour and
Carbon Dioxide as a function of wavelength (...) The percentage
absorption of a vertical beam by representative atmospheric
concentrations of water vapour (H2O) and carbon
dioxide (CO2) are shown "
according to
Australia
2007, Bureau of Meteorology (BOM) -
Geoscience
Australia, by Chris Hepplewhite.
|
| |
|
Zum
elektromagnetischen Spektrum vgl. Sie bitte auch:
Elektromagnetisches
Spektrum, von K. Ziemke, Universität Kiel, Geographisches
Institut, Fernerkundung - neue Methoden und Medien
für Geographie und Unterricht, Prof. Hassenpflug,
Material zur Vorlesung im Internet, 05.05.99 (am 3. Nov.
2019 nicht mehr online).
|
| |
| |
 |
| |
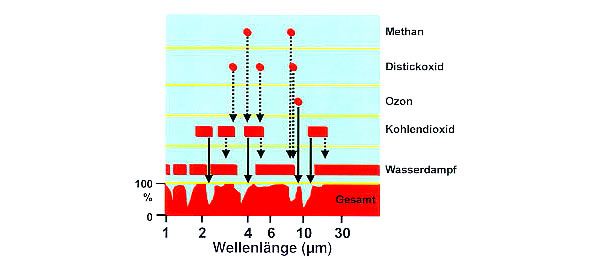
Abb. A2-37/02:
"Wasserdampf
ist das wichtigste Treibhausgas der Atmosphäre,
da es in einem breiten Wellenlängenbereich langwellige
Strahlung aufnehmen kann. Die übrigen Treibhausgase
spielen eine geringere Rolle, da der Wasserdampf
[siehe nächsten
Abschnitt] bereits einen grossen Teil der Strahlungsenergie
aufgenommen hat."
(aus
Berner & Streif 2000: 25)
|
| |
| |
 Zur
solar-terrestrischen Strahlungsbilanz: Zur
solar-terrestrischen Strahlungsbilanz: |
| |
|
 Tsushima, Y., A. Abe-Ouchi, and S. Manabe, (2005)
Radiative damping of annual variation in global mean
surface temperature: comparison between observed and
simulated feedback.- Climate dynamics, published
online before print March 25, 2005
Tsushima, Y., A. Abe-Ouchi, and S. Manabe, (2005)
Radiative damping of annual variation in global mean
surface temperature: comparison between observed and
simulated feedback.- Climate dynamics, published
online before print March 25, 2005
-
Abstract:
"The sensitivity of
the global climate is essentially determined by the radiative damping of the global mean surface temperature
anomaly through the outgoing radiation from the top of the atmosphere (TOA). Using the TOA fluxes
of terrestrial and reflected solar radiation obtained from the Earth radiation budget experiment (ERBE),
this study estimates the magnitude of the overall feedback, which modifies the radiative damping of
the annual variation of the global mean surface temperature, and compare it with model simulations.
Although the pattern of the annually varying anomaly is quite different from that of the global warming,
the analysis conducted here may be used for assessing the systematic bias of the feedback that operates
on the CO2-induced warming of the surface temperature.
In the absence of feedback effect,
the outgoing terrestrial radiation at the TOA is approximately follows the Stefan-Boltzmann’s
fourth power of the planetary emission temperature. However, it deviates significantly from the blackbody
radiation due to various feedbacks involving water vapor and cloud cover. In addition, the reflected
solar radiation is altered by the feedbacks involving sea ice, snow and cloud, thereby affecting the
radiative damping of surface temperature. The analysis of ERBE reveals that the radiative damping
is weakened by as much as 70% due to the overall effect of feedbacks, and is only 30% of what is expected
for the blackbody with the planetary emission temperature. Similar feedback analysis is conducted
for three general circulation models of the atmosphere, which was used for the study of cloud feedback
in the preceding study. The sign and magnitude of the overall feedback in the three models are similar
to those of the observed.
However, when it is subdivided into solar and terrestrial components,
they are quite different from the observation mainly due to the failure of the models to simulate
individually the solar and terrestrial components of the cloud feedback. It is therefore desirable
to make the similar comparison not only for the overall feedback but also for its individual components
such as albedo- and cloud-feedbacks. Although the pattern of the
annually-varying anomaly is quite different from that of global warming, the methodology of the comparative
analysis presented here may be used for the identification of the systematic bias of the overall feedback
in a model. A proposal is made for the estimation of the best guess value of climate sensitivity using
the outputs from many climate models submitted to the Intergovernmental panel on Climate Change."
|
| |
|
CERES:
Understanding the Earth’s Clouds and Climate |
|
What
CERES Will Measure
"CERES will measure the energy at the
top of the atmosphere, as well as estimate energy levels in the atmosphere and at the Earth’s
surface. Using information from very high resolution cloud imaging instruments on the same spacecraft,
CERES also will determine cloud properties, including altitude, thickness, and the size of the cloud
particles. All of these measurements are critical for advancing the understanding of the Earth’s
total climate system and the accuracy of climate prediction models."
Cloud
Effects
"One of the most intriguing questions
facing climate modelers today is how clouds affect the Earth’s climate and vice versa. The
U.S. Global Change Research Program classifies understanding the role of clouds and the Earth’s
energy budget as one of its highest scientific priorities. Understanding cloud effects requires a
detailed knowledge of how clouds absorb and reflect sunlight, as well as how they absorb and re-emit
outgoing heat emitted by the planet. For example, low, thick clouds primarily reflect incoming solar
energy back to space causing cooling. Thin, high clouds, however, primarily trap outgoing heat and
produce warming. To date, satellite studies have found that clouds have an overall cooling effect
on the Earth.
Analyses of satellite data also indicate that
clouds which form over water are very different from clouds which form over land. These differences
affect the way clouds reflect sunlight back into space and how much heat emitted from the Earth the
clouds absorb and re-emit. For example, over the equator in the eastern Pacific Ocean during El Niño
events, there is a significant decrease in the amount of energy emitted by the Earth due to increased
cloudiness. El Niño events occur when portions of the eastern Pacific Ocean become considerably
warmer than normal, causing an increase in cloudiness over the region. These changes can affect weather
patterns around the world."
Water Vapor Effects
"Water vapor in the atmosphere also impacts
our daily weather and climate, though scientists are only beginning to understand how this complex
mechanism works. Water vapor acts like a greenhouse gas and absorbs outgoing heat to warm
the Earth. Because water vapor also condenses to make clouds, additional water vapor in the atmosphere
also may increase the amount of clouds."
|
| |
|
| |
Weiterführende
Links zum Thema "Global Warming" etc. innerhalb dieser Website (  nur
kurze Hinweise!): nur
kurze Hinweise!): |
| |
 Das zyklische Auftreten von Kalt- und Warmzeiten im Laufe
der Erdgeschichte.
Das zyklische Auftreten von Kalt- und Warmzeiten im Laufe
der Erdgeschichte.
Das
zyklische Auftreten Warm- und Kaltzeiten (150 Mio. Zykluszeit
/ Eis-Zeitalter)
Das
zyklische Auftreten Warm- und Kaltzeiten (125.000. Zykluszeit
/ Eiszeit-Zyklus)
Klimaschwankungen
im Jungpleistozän und Holozän und Vegetationsgeschichte
Kurzer
Überblick zur Klimageschichte
Literaturangaben
zur Klimageschichte, kleine Auswahl
Globalklimatische
Grundlagen und Entstehung von Vegetationszonen
Die
glaziale und postglaziale Vegetationsgeschichte Afrikas
Postglaziale
aride und humide Phasen in der Sahara Afrikas
Meeresspiegel
während des LGM (120m unter NN) u. Simulation um
+5m ü.NN
Glaziale
bis postglaziale Nordseegeschichte
Entwicklung
der Insel Sylt
Holozäne
Optima und Pessima
2000
Jahre Temperaturentwicklung der nördlichen Hemisphäre,
Bemerkungen zum "Hockeystick"
Sargasso
Sea Surface Temperature (3000 BP - Present)
Der sogenannte
Treibhauseffekt
Hurrikane haben
nicht immer Saison
Elektromagnetisches
Spektrum, Strahlungsenergie und Absorption
Die Bedeutung
von Kohlendioxid
Der
Kohlenstoffkreislauf - Ein kleiner Einblick
Das
zyklische Auftreten von Sonnenzyklen |
| |
 |
| |
|
Copyright
© Harald Kehl
ehemals TU-Berlin - Institut für Ökologie
|
| |


|
| |
|
|
|
| |
|
|
|
|
|
