| |
|
|
 |
|
|
| |
|
|
| |
 |
Konservative
Rekonstruktionen (A): |
| |
- ANMERKUNG:
Ein aufmerksamer Besucher dieser Website teilte freundlicherweise
am 15.01.07 mit, dass die hier von Houghton
et al. (1990, Eds) in "Climate
Change, The IPCC Scientific Assessment", Appendix
1. Cambridge University Press, (p: 202) gezeigte
Grafik aus folgender Publikation stammt: LAMB,
H.H. (1977): Climate Present, Past And Future Volume
2: Climatic history and the future. - Methuen &
co Ltd, London (page 440). "Die Klimadaten
wurden ausschliesslich in Mittelengland erfasst
und auch nur bis 1970", so der hilfreiche
Hinweis. In der Originalabbildung reichen die Daten
bis in die 20er Jahre, weshalb dort die Kurve nach
oben zeigt. In den Darstellungen bis 1970 zeigt dagegen
das Ende der Kurve nach unten.
|
| |
 |
| |
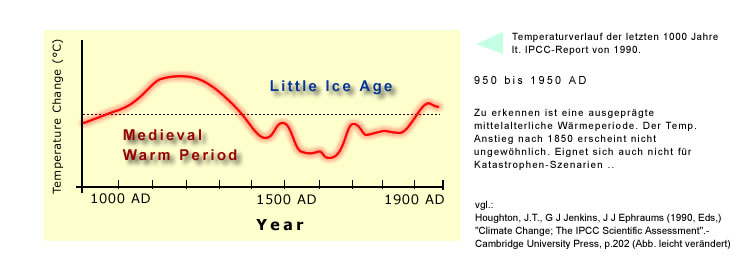
 Abb.
A2-24/01 (ident.
mit A2-04/01):
Abb.
A2-24/01 (ident.
mit A2-04/01):
Temperaturverlauf
der letzten 1.000
Jahre (950-1950[70] AD) laut IPCC-Report, 1990 (nach
Houghton et al. 1990). Lit. - Angabe rechts unten
in der Grafik!
|
|
|
 |
| |
|
Unrealistische
Rekonstruktionen und Manipulationen (B): |
| |
 |
|
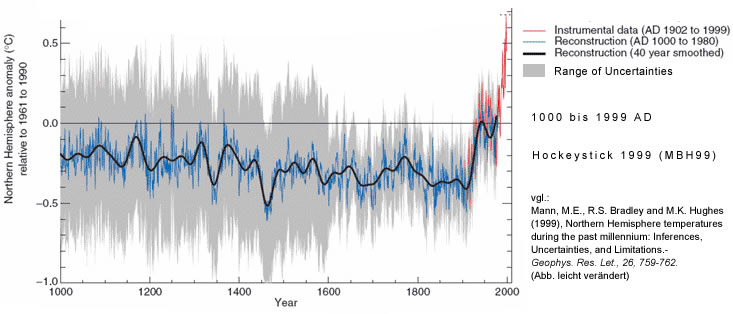
Abb.
A2-24/02
(ident.
mit A2-04/02):
Hockeystick-Kurve
- Temperaturverlauf der letzten 1.000 Jahre (1000-2000
AD) laut IPCC-Report von 2001 (nach Mann, M.E, R.S.
Bradley and M.K. Hughes (1998) Global-scale temperature
patterns and climate forcing over the past six centuries.-
NATURE, VOL 392, 23 April).
|
|
In
der Lit. oft abgek. unter  MBH98/99
- MBH98/99
-  - 208KB, 12
S. bzw.
MBH1999
- 208KB, 4
S. (mit der Originalgrafik, vgl. dort letzte
Seite, Figure 3). Lit. - Angabe rechts unten in der
Grafik! Die Grafik erlangte "Weltruhm" als
"Hockeystick-Kurve".
In folgenden Veröffentlichungen wurde der
wichtigste Bereich Range
of Uncertainties i.d.R überhaupt nicht
mehr eingezeichnet (auch nicht erwähnt) und auch
die Rekonstruktion (blaue Linie) weggelassen. Es tauchte
dann nur noch die geglättete Kurve auf (siehe unten!).
In diese geglättete Kurve wurde dann die Kurve
des CO2 - Gehaltes eingetragen (siehe unten!), was zu
dem Eindruck führte, Temperaturverlauf und CO2-Gehalt
in der Atmosphäre zeigten eine hochsignifikante
Beziehung.
- 208KB, 12
S. bzw.
MBH1999
- 208KB, 4
S. (mit der Originalgrafik, vgl. dort letzte
Seite, Figure 3). Lit. - Angabe rechts unten in der
Grafik! Die Grafik erlangte "Weltruhm" als
"Hockeystick-Kurve".
In folgenden Veröffentlichungen wurde der
wichtigste Bereich Range
of Uncertainties i.d.R überhaupt nicht
mehr eingezeichnet (auch nicht erwähnt) und auch
die Rekonstruktion (blaue Linie) weggelassen. Es tauchte
dann nur noch die geglättete Kurve auf (siehe unten!).
In diese geglättete Kurve wurde dann die Kurve
des CO2 - Gehaltes eingetragen (siehe unten!), was zu
dem Eindruck führte, Temperaturverlauf und CO2-Gehalt
in der Atmosphäre zeigten eine hochsignifikante
Beziehung.
"Bis
ca. 1900 zeigt das Diagramm ein relativ stabiles Klima
mit abkühlender Tendenz - der Schaft des Hockeysticks.
Der Temperaturanstieg begann um 1900 parallel zu einem
starken Anstieg der Treibhausgase - das Blatt des Hockeysticks.
Im Klimabericht des IPPC der UNO 2001 heisst es: 'Wie
Grafik (...) zeigt scheinen die Rate und Dauer der Erwärmung
der Nördlichen Hemisphäre im 20. Jahrhundert
beispiellos gewesen zu sein in den letzten Tausend Jahren
und können auch nicht einfach als eine Erholung
von der kleinen Eiszeit vom 15. bis 19. Jahrhundert
erklärt werden.'
- Hinzu
kommt,
dass die MBH98-Kurve die mittelalterlichen
Temp., die nach
 Cubasch
et al. (2004)
Simulating the last 1000 years
with a 3d coupled model)
-
-
File, 17 S. und Moberg
et al. (2005) Highly
variable ..., etwa den
heutigen entsprachen (nach Moberg
et al. etwa bis in die späten 80er Jahre
des letzten Jahrhunderts), nicht abbildet. Cubasch
et al. (2004)
Simulating the last 1000 years
with a 3d coupled model)
-
-
File, 17 S. und Moberg
et al. (2005) Highly
variable ..., etwa den
heutigen entsprachen (nach Moberg
et al. etwa bis in die späten 80er Jahre
des letzten Jahrhunderts), nicht abbildet.
- Vgl.
Sie dazu auch:
Hans von Storch, Eduardo Zorita, Julie M. Jones, Yegor
Dimitriev, Fidel González-Rouco, Simon F. B.
Tett (2004) Reconstructing Past Climate from Noisy
Data.- Science, Vol. 306. no. 5696, pp. 679 - 682.
(Abb.
/ Text)
- Ohne
Zweifel sollte mit MBH98/99 überzeugend dargestellt
werden, dass Temperaturverlauf und Gehalt an CO2
in der Atmosphäre eng gekoppelt sind. Eine häufig
verwendete und vergleichbare Grafik findet sich auch
aktuell noch auf der
Website
von Wikipedia zum Nachweis der "Engen Koppelung
von Kohlendioxidgehalt in der Atmosphäre und
der Temperatur auf der Erde." Derartige Manipulationen
dürfen nicht akzeptiert werden.
- "Killerargument
Hockeystick - ein Dogma wird geboren
In Tausenden Publikationen weltweit wurde immer wieder
der Hockeystick angeführt, um von einer menschengemachten
Klimaerwärmung zu überzeugen. Ein Beispiel
für den öffentlichkeitswirksamen Gebrauch
des Hockeystick zeigte jüngst der Bericht
"Arctic Climate Impact Assessment" (ACIA)
[date of access: 08.01.2007, nicht mehr online 15.11.2019]
von
2004. Er soll politischen Entscheidungsträgern
dabei helfen die richtigen Beschlüsse zum Schutze
der Arktis zu treffen. Er wurde für den Arktischen
Rat, einem Gremium der Arktis-Anrainerstaaten, hergestellt.
Der Hockeystick stellt im Bericht eine zentrale
Argumentation dar, um eine menschengemachte Klimaerwärmung
mittels Treibhausgasen zu begründen." (Text:
Klaus Öllerer in
Der Hockeystick)
Auch heute noch findet sich diese Grafik auf den
Websites
des Umweltbundesamtes (UBA), obwohl die Darstellung
wissenschaftlich falsch und darüber
hinaus manipulativ ist. Vgl. Sie dazu auch die Bemerkungen
von Cubasch, von Storch,
sowie .
Technology
Review (Marcel Krok) und
Technology
Review (R.A. Muller) [date
of access: 07.05.2007]
- Eine
umfangreiche Dokumentation
zur Kontroverse
um die sogenannte "Hockeystick-Kurve"
finden Sie auf der englischsprachigen
Wikipedia-Seite.
Die kritischen Bemerkungen von H. von Storch werden
ausführlich kommentiert, jedoch ist auf die Interpretation
der Aussagen von von Storch zu achten.
 Gleichwohl,
die Seite ist sehr detailreich und sehr zu empfehlen! Gleichwohl,
die Seite ist sehr detailreich und sehr zu empfehlen!
- In
einem Artikel von Richard L. Smith (2007) The
role of statisticians in public policy debates over
climate change"
-
-
File, 2,4MB, 12 S. in einem Newsletter der
American Statistical Association, Vol.9/1, wird auf
die Diskussion um die "Hockeystick-Kurve"
in dem Wegman-Report eingegangen. Bei Smith heisst
es u.a.: "A number of other commentators have
acknowledged the flaws in the Mann reconstruction
but have argued that this does not matter because
the answers have been verified by other analyses.
Ed's [Edward Wegman's] own response
to that was given in the equation: In other words,
the fact that the answer may have been: Method
Wrong + Answer Correct = Bad Science."
[Hervorh. durch den Autor].
- Von
interessierter Seite wird gerne behauptet, die
MBH-Kurve und die ihr zugrunde liegenden Methoden
seien durch Untersuchungen des "National Research
Council (NRC) of the United
States National Academy of Sciences" bestätigt
worden.
 Diese
Aussage ist evtl. falsch. Es wurden wesentliche
statistische Mängel konstatiert ("statistical
shortcomings in the MBH analysis").
Der o.g. Wegman-Report
-
[ 91S.] und der NRC-Report erschienen
2006 / 2010 und sind hier
verlinkt. Diese
Aussage ist evtl. falsch. Es wurden wesentliche
statistische Mängel konstatiert ("statistical
shortcomings in the MBH analysis").
Der o.g. Wegman-Report
-
[ 91S.] und der NRC-Report erschienen
2006 / 2010 und sind hier
verlinkt.
- Die
wesentlichen Aussagen des NRC-Reports waren
(wiedergegeben auf der engl.sprachigen
Wikipediaseite):
- "The
instrumentally measured warming of about 0.6
°C (1.1 °F) during the 20th century
is also reflected in borehole temperature
measurements, the retreat of glaciers, and
other observational evidence, and can be simulated
with climate models.
-
Large-scale surface temperature reconstructions
yield a generally consistent picture of temperature
trends during the preceding millennium, including
relatively warm conditions centered around
A.D. 1000 (identified by some as the “Medieval
Warm Period”) and a relatively cold
period (or “Little Ice Age”) centered
around 1700. The existence and extent
of a Little Ice Age from roughly 1500 to 1850
is supported by a wide variety of evidence
including ice cores, tree rings, borehole
temperatures, glacier length records, and
historical documents. Evidence for regional
warmth during medieval times can be found
in a diverse but more limited set of
records including ice cores, tree rings, marine
sediments, and historical sources from Europe
and Asia, but the exact timing and duration
of warm periods may have varied from region
to region, and the magnitude
and geographic extent of the warmth are uncertain.
-
It can be said with a high
level of confidence that global
mean surface temperature was higher during
the last few decades of the 20th century than
during any comparable period during the
preceding four centuries. This statement
is justified by the consistency of the evidence
from a wide variety of geographically diverse
proxies.
- Less
confidence can be placed in large-scale
surface temperature reconstructions for the
period from A.D. 900 to 1600. Presently
available proxy evidence indicates that temperatures
at many, but not all, individual locations
were higher during the past 25 years than
during any period of comparable length since
A.D. 900. The uncertainties associated
with reconstructing hemispheric mean or global
mean temperatures from these data increase
substantially backward in time through this
period and are not yet fully quantified.
- Very
little confidence can be assigned
to statements concerning the hemispheric mean
or global mean surface temperature prior
to about A.D. 900 because of sparse data
coverage and because the uncertainties associated
with proxy data and
the methods used to analyze and combine
them are larger than during more recent time
periods."
(Hervorhebungen durch den Autor)
|
|
| |
 |
| |
Abb.
A2-24/03 (ident.
mit A2-04/03):
Typisches Beispiel für die vereinfachte
Übernahme der MBH98-Grafik durch Sands
(2005: 175), mit dem Hinweis: "adapted from
IPCC, 2001". Hier fehlt bereits jeglicher
Hinweis auf den Bereich der unsicheren Aussagen
(Range of Uncertainties).
Es wird nur noch eine geglättete Kurve wiedergegeben
(40 year smoothed), was sie extrem spektakulär
aussehen lässt. Zitat: "The
1990s had the most rapid increase in global temperature
of any decade in the last 1000 years (Houghton et
al., 2001)."
|
| |
| |
Derartige
Vereinfachungen, basierend auf schlechter Wissenschaft,
wurden hundertfach vorgenommen und dienten als Argumentationsbasis,
übrigens auch noch aktuell (siehe oben und nächste
Grafik unten!). Sands (2005:
175) ist kaum ein Vorwurf zu machen, denn er
berief sich schliesslich auf das IPCC und dieses wiederum
auf eine wissenschaftliche Arbeit in NATURE.
Aber
man darf vermuten, allen Nutzern der Grafik passte
sie hervorragend ins Konzept.
|
| |
| |
- Nebenbei
und doch sehr wichtig bzgl. "Range of Uncertainties":
"In
a letter to Nature on August 10, 2006, Bradley, Hughes
and Mann pointed at the original title of their 1998
article: "Northern Hemisphere temperatures during
the past millennium: inferences, uncertainties, and
limitations" and pointed out "more widespread
high-resolution data are needed before more confident
conclusions can be reached and that
the uncertainties were the point of the article."
(aus Hockey
Stick Controversy: Updates, in Wikipedia). Das
klingt dann doch eher unglaubwürdig und hilflos
vor dem Hintergrund einer eingezeichneten "40
years smoothed" Kurve und bestärkt noch
mehr die Vermutung einer bewussten Irreführung.
- Zum
Selbstverständnis und den Feindbildern von Michael
Mann,
mittlerweile
"Associated Professor of meteorology and geosciences
at Pennsylvania State University and director of the
university's Earth System Science Center", hier
ein Statement:
"Unfortunately, there are a number of so-called
"organizations," a lot of their funding
can be traced back to fossil fuel corporations. They're
often not much more than a p.o. box and an individual
or two who are behind them. They have been paid money
to manufacture false controversy. They've been doing
that for years. That has been a particularly profound
influence here in the United States. That'll probably
continue to go on for some time.
I'm pleased, and many of us are pleased that Exxon-Mobil
has announced that they are no longer going to provide
funding for many of these organizations that they
were providing to manufacture this false controversy.
This was actually detailed in an extensive report
by the Union of Concerned Scientists that was issued
about a month ago, where they detailed all of the
unfortunate ways that Exxon-Mobil had been funding
to cloud the public understanding of the science.
Well, it looks like they're backing away from that
now. But I don't think that that means that we're
not going to see some efforts of that sort again,
even with this next IPCC report. So we shouldn't be
surprised that there will be some talking heads out
there, probably most of them financed by industry,
to try to confuse the public's understanding of the
report, to try to raise false criticisms of the conclusions
that have been drawn. We're going to see some of that.
There's no question. So it's important for us to keep
in mind that we're probably seeing the last gasps
of this sort of disinformation effort that is probably
in its tail end now that the science has become ever
more strong as time has gone on."
Aus:
Earth & Sky (Feb. 2, 2007) [offline
15.11.2019] emailed about 500 scientists
asking, "What would like
to tell the American public, right now, about global
warming?" We didn't select any scientists
in particular, although we tried to contact scientists
who are experts on climate. Twenty six scientists
were kind enough - and concerned enough - to answer.
- In
einer aktuellen
Publikation scheinen Michael Mann und Kollegen
jedoch das Mittelalterliche Wärme-Optimum wiederentdeckt
zu haben.
|
|
| |
 |
| |
Abb.
A2-24/04 (ident.
mit A2-04/04):
Typisches Beispiel für den manipulativen
Charakter von geglätteten Kurven.
|
| |
 Ausführliche
Behandlung des Themas:
Ausführliche
Behandlung des Themas:
The
Hockey Stick Illusion - Climategate and the Corruption
of Science (2010) by Andrew Montford.
Reception (aus Wikipedia):
-
"Writing in Prospect
Magazine Matt Ridley, [16
March 2010]
the former science editor of The Economist, said
that this book was one of the best science books
written in years and that "It exposes in
delicious detail, datum by datum, how a great
scientific mistake of immense political weight
was perpetrated, defended and camouflaged by a
scientific establishment that should now be red
with shame"
-
George Gilder,writing
in Discovery News, said "In this story, the
Columbo figure is Steve McIntyre, a Canadian mining
consultant, and A.W. Montford's book tells the
gripping and suspenseful details of McIntyre's
pursuit of the self-denominated "hockey team"
led by Michael Mann, who wrote the key chapters
on his own work for the IPCC, and Phil Jones,
who maintains the temperature record used by the
IPCC to document the "Hockey Stick"
claiming allegedly unprecedented and anomalous
anthropogenic global warming in the Twentieth
Century while denying that any comparable or greater
warming occurred in the Medieval period",
and "Don't miss this definitive book".
-
Christopher Booker, in an article
for The Daily Telegraph, wrote, "we can
now read in shocking detail the truth of the outrageous
efforts made to ensure that the same 2007 report
was able to keep on board IPCC's most shameless
stunt of all – the notorious "hockey
stick" graph purporting to show that in the
late 20th century, temperatures had been hurtling
up to unprecedented levels".
-
Andrew Bolt wrote in
the Herald Sun "The astonishing history
of the fake hockey stick that was used to convince
so many dupes the world hadn't ever been this
hot in human history. Learn how scientists put
up the walls rather than help expose a critically
important mistake".
-
Nigel Calder,
former editor of the New Scientist magazine, and
co-author of The Chilling Stars wrote, "this
is a thriller about codebreaking, computer codes
that generated a false signal to the world about
runaway global warming".
[last date of access: 06.04.2019]
Eine
leicht verständliche Analyse liefert der
an Klimafragen interessierte Publizist
Klaus
Öllerer auf seiner Website "KlimaNotizen"
zur Diskussion um die Hockeystick-Kurve. Er schreibt:
- "
... der “Hockeystick” (Hockeyschläger)
ist in der Öffentlichkeit seit Jahren eine
der wichtigsten Begründungen für eine
menschengemachte Klimaerwärmung. Er legt
den Gedanken nahe, dass die Erwärmung im
20. Jahrhundert höchstwahrscheinlich durch
den Menschen verursacht ist.
- Es
gibt neue Erkenntnisse, die die Klimawissenschaft
nun zunehmend beschäftigen. Danach ist dieser
Hockeystick grob falsch.
- Offensichtlich
wurde dieses Kernstück der Klimapolitik vorher
noch nie im Detail unabhängig wissenschaftlich
überprüft.
- Prof.
Mann, der den Hockeystick geschaffen hat, verweigert
die vollständige Offenlegung seiner Methoden
und Daten." [last
date of access: 06.12.2019]
|
|
|
| |
|
Realistischere
Rekonstruktionen (C): |
| |
| |
 |
| |
Abb.
A2-24/05 (ident.
mit A2-04/05):
Storch
et al. (2004) mit neuer
Rekonstruktion der Temperaturen in der Nordhemisphäre
der letzten 1000 Jahre. Literaturangabe rechts auf
der Grafik. Um eine bessere Vergleichbarkeit zu
ermöglichen, wurde diese Grafik bei Ordinate
und Abzisse der Mann, Bradley, Hughes - Grafik angeglichen.
Siehe zum Vergleich die MBH98/99
- Hockeystickkurve oben und den treffenden Kommentar
von Storch dazu.
[date
of access: 20.08.2019]
|
| |
| |
 |
| |
Abb.
A2-24/06 (ident.
mit A2-04/06):
"A
new data set has been announced by the National
Oceanic and Atmospheric Administration’s National
Climatic Data Center (NCDC). This is a 1,000
year temperature reconstruction for the Northern
Hemisphere, published by
Esper et al. in Science, which attempts
to preserve low-frequency climate variability potentially
lost in other tree-ring based climate reconstructions.
The data, and many similar data sets, can be obtained
on NCDC’s Paleoclimatology website.
[date
of access: 11.10.2007]
|
|
|
| Bitte
beachten Sie die ausgeprägte Temperatur-Variabilität
während der mittelalterlichen
Warmzeit innerhalb extrem kurzer Zeiträume!
|
| |
|
Vgl.
dazu auch die Abstracts bzw. Auswertungen der Arbeiten
von
- LaMarche
(1974), (dendrologische Untersuchungen an der
Borstenkiefer, ca. 1100 Jahre)
- Cubasch
et al. (2004), (neue Rekonstruktion der Temperaturen
in der Nordhemisphäre der letzten 1000 Jahre)
-
Grinsted,
A., et al. (2006) (Svalbard summer melting, continentality,
and sea ice extent from the Lomonosovfonna ice core)
-
Moberg
et al. (2005) (Rekonstruktion des Temperaturverlaufs
der letzten 2000 Jahre), vgl. die folgende Abb.
|
|
|
| |
 |
| |
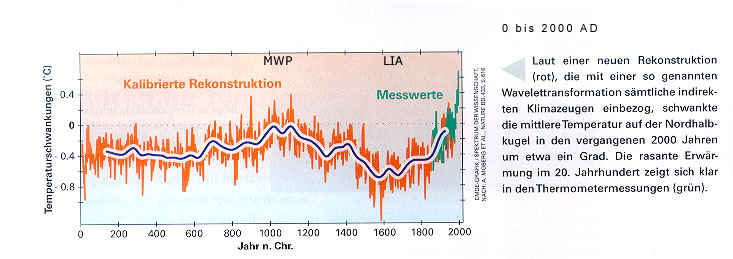
Abb.
A2-24/07 (ident.
mit A2-04/07):
Temperaturverlauf der letzten
2.000 Jahre (0-2000
AD)
ohne Berücksichtigung dendrologischer Daten.
Literaturangabe rechts neben der Grafik, Grafik
stark verändert und angepasst. Die
Daten dazu finden Sie
hier.
|
|
- Abstract:
"Historical data provide a baseline for judging
how anomalous recent temperature changes are and for
assessing the degree to which organisms are likely
to be adversely affected by current or future warming.
Climate histories are commonly reconstructed from
a variety of sources, including ice cores, tree rings,
and sediment. Tree-ring data, being the most abundant
for recent centuries, tend to dominate reconstructions.
There are reasons to believe that tree ring data may
not properly capture long-term climate changes. In
this study, eighteen 2000-year-long series were obtained
that were not based on tree ring data. Data in each
series were smoothed with a 30-year running mean.
All data were then converted to anomalies by subtracting
the mean of each series from that series. The overall
mean series was then computed by simple averaging.
The mean time series shows quite coherent structure.
The mean series shows the Medieval
Warm Period (MWP) and Little
Ice Age (LIA) quite clearly, with the MWP being
approximately 0.3°C warmer than 20th century values
at these eighteen sites."
Diskussion
der Publikation bei ClimateAudit und hier
(auch ClimateAudit)
- Aufschlussreiche
(kritische)
Bemerkung von Craig Loehle (vgl. Eintrag No. 54):
"I am more than a little disturbed by the
distinction between climate scientists and sceptics.
This implies that no climate scientist has any quibbles
with any of the current science. I have a 5 foot tall
stack of climate science reprints that begs to differ.
I have papers saying Antarctica is gaining and losing
ice, that clouds warm and cool (+ and - feedback),
that the calibration of GCMs is iffy, that the dynamical
stability of GCMs is iffy, that the Medieval
Warm Period did and did not exist, that the sun
is a major and a trivial factor in 20th century climate
change, that urban heat islands have and have not
been properly accounted for. I only stopped because
I got tired of typing. I would suggest that not one
of these issues is “settled” and neither
are they trivial for the climate forecasts."
|
|
| |
| |
 |
| |
Abb.
A2-24/08 (ident.
mit A2-04/08):
Temperaturverlauf der letzten 2.000 Jahre
(0-2000
AD) lautMoberg
et al. (2005). Lit. - Angabe siehe unten! Die
Grafik zeigt deutlich eine starke Erwärmung
im Mittelalter
(zwischen etwa 1000 und 1100 AD) und eine starke
Abkühlung im 16. und 17. Jahrhundert.
|
| |
Abstract:
"A number of reconstructions of millennial-scale
climate variability have been carried out in order
to understand patterns of natural climate variability,
on decade to century timescales, and the role of anthropogenic
forcing. These reconstructions have mainly used tree-ring
data and other data sets of annual to decadal resolution.
Lake and ocean sediments have a lower time resolution,
but provide climate information at multicentennial
timescales that may not be captured by tree-ring data.
Here we reconstruct Northern Hemisphere temperatures
for the past 2,000 years by combining low-resolution
proxies with tree-ring data, using a wavelet transform
technique to achieve timescale-dependent processing
of the data. Our reconstruction shows larger multicentennial
variability than most previous multi-proxy reconstructions,
but agrees well with temperatures reconstructed from
borehole measurements and with temperatures obtained
with a general circulation model. According to our
reconstruction, high temperatures - similar to those
observed in the twentieth century before 1990- occurred
around AD 1000 to 1100, and minimum temperatures that
are about 0.7K below the average of 1961-90 occurred
around AD 1600. This
large natural variability in the past suggests an
important role of natural multicentennial variability
that is likely to continue."
|
| |
Die
Abbildung oben (A2-04/08) wurde dem
Beitrag von
- Sven
Titz (2005) zum Thema "Forschung aktuell - Historische
Temperaturwellen", im Spektrum der Wissenschaft,
April 2005, S. 24, entnommen. Die Abb.
selbst wurde von SdW nach
- Moberg,
A. et al. (2005) Highly
Variable Northern Hemisphere Temperatures reconstructed
from low- and high-resolution proxy data.- Nature,
Vol. 433, No. 7026, pp.. 613-617, 10 February 2005.
, entwickelt und entspricht ihr vollständig,
bis auf die deutschen Beschriftungen..
|
|
|
 WICHTIGE
ANMERKUNG:
WICHTIGE
ANMERKUNG:
Die Rekonstruktionen der Temperaturschwankungen durch
Esper
et al. (2002), Moberg
et al. (2005) sowie die ältere Arbeit von LaMarche
(1974) lassen ahnen, dass die mittelalterlichen
Optimum-Temperaturen sich nicht von den aktuellen
unterscheiden. Eventuell lagen sie sogar höher.
Es
sollte aber klar sein, dass jede kalibrierte Rekonstruktion
mit grossen "Messwert"unsicherheiten behaftet
ist. Es handelt sich um wahrscheinliche bzw. 'hochgerechnete'
Temperaturschwankungen, welche selbst keinesfalls die
tatsächlichen Schwankungen spiegeln. Diese waren
wohl wesentlich stärker ausgeprägt, was sich
über einen Vergleich der heutigen Referenzmedien
mit den aktuell gemessenen Werten leicht nachweisen
lässt.
Die
hier suggerierte Vergleichbarkeit mit den Messwerten
ist daher unzulässig. Proxydaten müssen
aus methodischen Gründen immer abgeschwächte
Min.- und Max-Daten zeigen. In diesem Kontext ist interessant,
dass die gegenwärtige - angeblich einmalige und
besondere - Zunahme der Temperaturen generell lokal
und regional sehr unterschiedlich ist (was leider immer
wieder vergessen wird) und sich m.W. bisher z.B.
dendrologisch
nirgendwo manifestierte (siehe besonders die Lit.-Angabe
Briffa
et al. (2004)
folgend.
Dagegen
kann nicht oft genug wiederholt werden, dass die dendrologischen
Auswertungen von
 Esper
et al. (2002) (Grafik oben, bis ca. 1980),
Esper
et al. (2002) (Grafik oben, bis ca. 1980),
LaMarche
(1974) (Grafik unten, bis ca. 1950) sowie
Briffa
et al. (2004) (ab 1400 bis ca. 2000, eine Grafik
dazu finden Sie hier)
deutlich die mittelalterliche
Warmzeit (ausser Briffa et al. natürlich)
mit offensichtlich höheren Temperaturen als aktuell
zeigen, sowie eine ausgeprägte Kleine Eiszeit
(besonders deutlich auch nachgewiesen in den Auswertungen
von Storch
et al. (2004)
und Cubasch et al. (2004)),
unterbrochen von einem leichtem Temperaturanstieg
um 1400 bzw. 1500 und einem Temperaturanstieg etwa
Mitte des 19. Jahrhunderts, welcher anhält, jedoch
noch nicht die mittelalterlichen Werte erreicht hat.
Leider
sind dendrologische Befunde ein wenig ins Zwielicht
geraten, seit Michael
Mann et al. (1998) - MBH98 - (Erfinder der Hockey-Stick-Kurve)
ihre Untersuchungen laut Stephen
McIntyre & Ross McKitrick (2005) u.a. zu etwa
70% auf nur eine einzige nordamerikanische Baumart
('Borstenkiefer' bzw. Bristlecone Pine - z.B. Pinus
longaeva) stützte (vgl.
Zensiertes
Verzeichnis in Technology Review, 03/2005).
Ohne Verwendung der Bristlecone Pine - Datenreihen und
deren methodisch unzulässige Bewertung in der HKA
(Hauptkomponentenanalyse), ergibt sich kein Hockeyschläger.
Berücksichtigt
man darüber hinaus
1.
den Umstand, dass Baumringentwicklungen bei dieser
Kiefer offensichtlich nur sehr eingeschränkt
Temperaturentwicklungen widerspiegeln (vgl. jedoch
die folgende Abbildung mit der Auswertung von LaMarche
(1974)),
2. den Umstand, dass damit die angewandte Methode
bestenfalls die Temperaturentwicklung in den westlichen
USA widerspiegelt und
3. den Umstand, dass offensichtlich die zur
Anwendung gekommenen Methoden einen Hockestick-Kurve
beweisen sollten (Statistician Francis Zwiers of
Environment Canada - a government agency - notes that
Mr. Mann's method "preferentially produces hockey
sticks when there are none in the data" cf.
Hockeystick
on Ice) und "Statistikexpertin Mia Hubert
von der Katholieke Universiteit in Belgien (...):
"Mit dieser Methode dominieren Jahresringe mit
einer Hockeyschläger-Form die HKA [Hauptkomponentenanalyse]"
cf.
Technology
Review (Marcel Krok) und
Technology
Review (R.A. Muller) - und: Mann et al., misused
certain statistical methods in their studies, which
inappropriately produce hockey stick shapes in the
temperature history -
U.S.
- Committee on Energy and Commerce - Report),
4. den Umstand, dass, wenn die Baumringe der Bristlecone
Pine nach der Methode von Mann et al. (1998/99) gar
nicht berücksichtigt werden, die ermittelte Kurve
fast identisch ist mit der von Moberg
et al. (2005) entwickelten Rekonstruktion, wird
die Fragwürdigkeit der Aussagen in MBH98 bzw
MBH99 sehr deutlich.
|
| |
|
| |
 |
| |
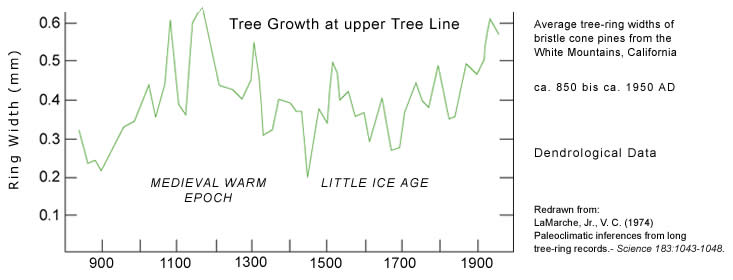
Abb.
A2-24/09 (ident.
mit A2-04/09):
Mittlere Breite der Baumringe der Borstenkiefer
(Bristlecone Pine) aus den White Mountains, Kalifornien.
Lit. - Angabe rechts von der Grafik! Generell ist
die Schwankungsbreite der Baumring-Breiten erheblich.
Zweifellos wurden von LaMarche
für das Mittelalter
zwischen etwa 1000 und ca. 1150 AD die breitesten
und durchschnittlich für die Kleine
Eiszeit die schmalsten Baumringe nachgewiesen.
|
| |
Vgl.
Sie auch:
Uwe Zerbst (1998)
Datierung
mittels Radiokarbon (14C) Teil IIa: Die Kalibrierung
von 14C-Altern. Grundlagen. Die nordamerikanischen
Borstenkiefernchronologien.- Studium Integrale
Journal 5. Jahrgang / Heft 2 - September 1998, Seite
57 - 69
|
| |
- Bzgl.
MBH98 bzw MBH99 steht nach wie vor die Frage im
Raum, weshalb Methoden und Messdaten - i.e. source
code - bis dato nicht offen gelegt wurden und erklärtermassen
auch nicht offen gelegt werden sollen!! - "Mann
told Antonio Regalado of the Wall Street Journal
[14 Febr. 2005] that he would not be "intimidated"
into releasing source code for MBH98.
Archäologische,
palynologische, sedimentologische, aber auch seriöse
dendrologische Befunde lassen als gesichert
erscheinen, die Durchschnittstemperaturen in Mittel-,
West- bis Nord-Europa lagen im Hochmittelalter vor
1000 bis 1100 Jahren sogar in einigen Landschaften
wesentlich über den aktuellen (vgl. Literatur
unten!), was auch während dieses Zeitabschnittes
zu extremen Abweichungen von den Mittelwerten geführt
haben muss. Wenn zu der Zeit genaue (Instrumenten-)
Messungen hätten stattfinden können, würden
diese vermutlich eine wesentlich grössere Schwankungsbreite
aufzeigen als die sogenannte "Range of Uncertainties"
ahnen lässt, welche ja nun seit
2006 die eigentliche Aussage von MBH98
war.
Eine Erhöhung des CO2 -Gehaltes
konnte übrigens während dieser Zeit nirgendwo
nachgewiesen werden.
Sehr
zu recht sagte daher in einem SPIEGEL-Interview
Prof.
Hans von Storch (Direktor des Instituts für
Küstenforschung des GKSS Forschungszentrums in
Geesthacht): “Die
Kurve ist Quatsch” - vgl.
SPIEGEL
Nr. 41/2004, S.158  mit
der korrigierten
Kurve,
publiziert in
Science
22 October 2004: Vol. 306. no. 5696, pp. 679 - 682)
- und
Prof.
Ulrich Cubasch (FU-Berlin, Meteorologie, Gf. Direktor,
Leiter AG Modellierung des Klimasystems), welcher ebenso
wie H.v.Storch sonst der Überzeugung ist, die gegenwärtige
globale Erwärmung sei im wesentlichen anthropogener
Natur, meinte: mit
der korrigierten
Kurve,
publiziert in
Science
22 October 2004: Vol. 306. no. 5696, pp. 679 - 682)
- und
Prof.
Ulrich Cubasch (FU-Berlin, Meteorologie, Gf. Direktor,
Leiter AG Modellierung des Klimasystems), welcher ebenso
wie H.v.Storch sonst der Überzeugung ist, die gegenwärtige
globale Erwärmung sei im wesentlichen anthropogener
Natur, meinte:
"Problematisch
an diesem Fall ist meiner Ansicht nach nur, dass Michael
Mann seine Daten
nicht offen legt. Und problematisch ist auch,
dass die Diskussion politisch so brisant ist."
Vergleichen
Sie dazu eine Anmerkung
von
Steve McIntyre
Die
Hockeystick-Kurve aus MBH98/99,
die nachweislich wissenschaftlich falsch und manipulativ
ist, wird wider besseres Wissen nach wie vor in dem
Al
Gore - Film "An inconvinient Truth" alarmistisch
als gesicherte wissenschaftliche Erkenntnis dargestellt
und mittlerweile Millionen von Schülern gezeigt.
Und
da die Hockeystick-Kurve mittlerweile arg in Verruf
geraten ist, zeigt sich anderswo auch ein deutliches
Abrücken von diesem ehemals unantastbaren "Beweisstück".
Und in der Tat, es gibt noch viele andere - wenn auch
nur schwache - Indizien für die Mitwirkung des
Menschen an der derzeitigen globalen Erwärmung.
Diese sind jedoch nicht so eindeutig wie der Hockeystick.
Vieles liegt im Bereich der Spekulation.
 ÜBRIGENS: Man kann - und muss
- sehr und mit grosser Überzeugung für das
Energiesparen, für hohe Effizienz bei der Nutzung
fossiler Energieträger als endlicher Ressource
und die Nutzung "alternativer Energien"
sein und kann - und muss - gleichzeitig gegen
unseriöse und unredliche Wissenschaft sein. Die
Idee, mit unlauteren Methoden und unter Vorspiegelung
falscher Tatsachen, "Gutes" tun zu müssen,
ja, sogar missionarisch "Weltrettungsphantasien"
anzuhängen a la Stephen Schneider ("...
we'd
like to see the world a better place ..."),
ist - wie die Geschichte vielfach lehrte und aktuell
lehrt - extrem gefährlich.
ÜBRIGENS: Man kann - und muss
- sehr und mit grosser Überzeugung für das
Energiesparen, für hohe Effizienz bei der Nutzung
fossiler Energieträger als endlicher Ressource
und die Nutzung "alternativer Energien"
sein und kann - und muss - gleichzeitig gegen
unseriöse und unredliche Wissenschaft sein. Die
Idee, mit unlauteren Methoden und unter Vorspiegelung
falscher Tatsachen, "Gutes" tun zu müssen,
ja, sogar missionarisch "Weltrettungsphantasien"
anzuhängen a la Stephen Schneider ("...
we'd
like to see the world a better place ..."),
ist - wie die Geschichte vielfach lehrte und aktuell
lehrt - extrem gefährlich.
|
|
|
| |
|
|
|
Weiterführende
Literatur etc.: |
| |
Weitere
Informationen folgend und im Teil
3, Literatur:
"The
Holocene", a Journal by
SAGE Publications.
- Bluemle,
John P. (1999)
Global
Warming: A Geological Perspective.- Arizona
Geological Survey, Vol. 29, No. 4.
cf. especially "Sargasso
Sea surface temperature" of the last 3.000
years"
(John P. Bluemle is State Geologist and Director
of North Dakota Geological Survey)
- Broecker,
Wallace S. (2001) Was
the Medieval Warm Period Global? - Science
Vol. 291. no. 5508, pp. 1497 - 1499
DOI: 10.1126/science.291.5508.1497
- "During
the Medieval
Warm Period (800 to 1200 A.D.), the
Vikings colonized Greenland. In his Perspective,
Broecker discusses whether this warm period
was global or regional in extent. He argues
that it is the last in a long series of
climate fluctuations in the North Atlantic,
that it was likely global, and
that the present warming should be attributed
in part to such an oscillation, upon which
the warming due to greenhouse gases is superimposed."
- Büntgen,
Ulf et al. (2011)
2500
Years of European Climate Variability and Human
Susceptibility.- Science DOI: 10.1126/science.1197175,
Published Online 13 January 2011.
"Abstract:
Climate variations have influenced the agricultural
productivity, health risk, and conflict level
of preindustrial societies. Discrimination
between environmental and anthropogenic impacts
on past civilizations, however, remains difficult
because of the paucity of high-resolution
palaeoclimatic evidence. Here, we present
tree ring–based reconstructions of Central
European summer precipitation and temperature
variability over the past 2500 years. Recent
warming is unprecedented, but modern hydroclimatic
variations may have at times been exceeded
in magnitude and duration. Wet and warm summers
occurred during periods of Roman and medieval
prosperity. Increased climate variability
from ~AD 250 to 600 coincided with the demise
of the Western Roman Empire and the turmoil
of the Migration Period. Historical circumstances
may challenge recent political and fiscal
reluctance to mitigate projected climate change."
- Büntgen,
Ulf, mit eigener Website:
Extrem
umfangreiche und aktuelle Informationen
und
Vorstellung
seiner aktuellen Publikationen.
[date
of access: 09.08.2021]
“What
are the causes and consequences – biotic
and/or abiotic – of past and present
changes in diverse, though often intertwined
environmental system components, across a
wide range of spatiotemporal scales? How can
different tree-ring archives, parameters and
techniques be optimised – intellectually,
conceptually and methodologically – to
provide scientific answers to timely, cross-epistemologically
and interdisciplinary, research questions
of topical relevance and associated with wildlife
biology, forest ecology, mycology, (paleo)climatology
and human history?”
 Die Fragen wurden der Website von
Prof. U. Büntgen entnommen (Professor
of Environmental Systems Analysis, Department
of Geography, University of Cambridge, Downing
Place, CB2 3EN Cambridge, UK, u.a.).
Die Fragen wurden der Website von
Prof. U. Büntgen entnommen (Professor
of Environmental Systems Analysis, Department
of Geography, University of Cambridge, Downing
Place, CB2 3EN Cambridge, UK, u.a.).
- "A
simulation of the climate of the last millennium
with a state-of-the art ocean-atmosphere climate
model, which has been forced with solar variability,
volcanism and the change in anthropogenic
greenhouse gases, shows global temperatures
during the Little
Ice Age of the order of 1 K colder than
present. This is markedly
colder than some accepted empirical reconstructions
from proxy data. In this simulation
temperature minima are reached in the Late
Maunder Minimum, (around 1700 A.D.) and the
Dalton Minimum (1820 A.D.), with global temperature
about 1.2 K colder than today. The
model also produces a Medieval
Warm Period around 1100 A.D., with global
temperatures approximately equal to present
values. A combination of model and
tree-ring data leads to an improved temperature
estimate for Northern Europe, but not for
Southern Europe."
- Demezhko,
D. Yu. & I. V. Golovanova (2007) Climatic
changes in the Urals over the past millennium.
An analysis of geothermal and meteorological
data.- Clim. Past 3: 237-242.
-
6 S.
Abstract
[partly]:
" .... Joint analysis of GSTH and meteorological
data bring us to the following conclusions.
First, ground surface temperatures in the
Medieval maximum during 1100–1200
was 0.38 K higher than the 20th century
mean temperature (1900–1960). The
Little Ice Age cooling was culminated in
1720 when surface mean temperature was 1.58
K below than the 20th century mean temperature.
Secondly, contemporary warming began approximately
one century prior to the first instrumental
measurements in the Urals. The rate of warming
was +0.25K/100years in the 18th century,
+1.15 K/100years in the 19th and +0.75 K/100years
in the first 80 years of the 20th. Finally,
the mean rate of temperature warming increased
in final decades of 20th century. An analysis
of linear regression coefficients in running
intervals of 11, 21 and 31 years, shows
that there were periods of warming with
almost the same rates in the past, including
the 19th century."
- Esper,
Jan, Edward R. Cook & Fritz H. Schweingruber
(2002) Low-Frequency
Signals in Long Tree-Ring Chronologies for Reconstructing
Past Temperature Variability.- Science
22 March 2002: Vol. 295. no. 5563, pp. 2250
- 2253.
Abstract:
"Preserving multicentennial climate
variability in long tree-ring records is
critically important for reconstructing
the full range of temperature variability
over the past 1000 years. This allows the
putative "Medieval Warm Period"
(MWP) to be described and to be compared
with 20th-century warming in modeling and
attribution studies. We demonstrate that
carefully selected tree-ring chronologies
from 14 sites in the Northern Hemisphere
(NH) extratropics can preserve such coherent
large-scale, multicentennial temperature
trends if proper methods of analysis are
used. In addition, we show that the average
of these chronologies supports the large-scale
occurrence of the MWP over the NH extratropics."
- Essex,
C., R. McKitrick and B. Andresen (2007)
Does
a global temperature exist?- J. Non-Equilibrium
Thermodynamics, 32, 1-28.
- "Physical,
mathematical, and observational grounds
are employed to show that there is no physically
meaningful global temperature for the Earth
in the context of the issue of global warming.
While it is always possible to construct
statistics for any given set of local temperature
data, an infinite range of such statistics
is mathematically permissible if physical
principles provide no explicit basis for
choosing among them. Distinct and equally
valid statistical rules can and do show
opposite trends when applied to the results
of computations from physical models and
real data in the atmosphere. A
given temperature field can be interpreted
as both “warming” and “cooling”
simultaneously, making the concept of warming
in the context of the issue of global warming
physically ill-posed."
- Hu,
Feng Sheng, Emi Ito, Thomas A. Brown, B. Brandon
Curry, and Daniel R. Engstrom (2001) Pronounced
climatic variations in Alaska during the last
two millennia.- Published online before print
August 21, 2001, 10.1073 / pnas. 181333798.
- "Paired
oxygen-isotopic analyses of abiotic carbonate
and benthic-ostracode shells from lake sediments
provide a continuous quantitative record
of growing-season temperature for the past
2000 years in the northwestern foothills
of the Alaska Range. This
record reveals three time intervals of comparable
warmth: anno Domini (A.D.) 0-300, 850-1200,
and post-1800, the latter two of which correspond
to the Medieval Climatic Anomaly and climatic
amelioration after the end of the Little
Ice Age. The
Little Ice Age culminated at A.D. 1700,
when the climate was approx 1.7°C colder
than at present. A marked climatic
cooling also occurred around A.D. 600, coinciding
with extensive glacial advances in Alaska.
Comparisons of this temperature record with
ostracode trace-element ratios (Mg/Ca, Sr/Ca)
further suggest that colder periods were
wetter and vice versa during the past 2000
years."
- Hughes,
Malcolm K. & Henry Frank Diaz (1994) The
Medieval Warm Period.- Springer, 244 pp.,
ISBN 978-0-7923-2842-1 (155 €).
- "The
Medieval Warm Period and the Little Ice
Age are widely considered to have been the
major features of the Earth's climate over
the past 1000 years. In this volume the
issue of whether there really was a Medieval
Warm Period, and if so, where and when,
is addressed. The types of evidence examined
include historical documents, tree rings,
ice cores, glacial-geological records, borehole
temperatures, paleoecological data and records
of solar receipts inferred from cosmogenic
isotopes. Growth in the availability of
several of these types of data in recent
years, and technical advances in their derivation
and use, warrant this state-of-the-art re-examination
of the Medieval Warm Period. The book will
be of value to all those with an interest
in the natural variability of the climate
system, for example those concerned with
anticipating and detecting human-produced
climate change."
- "Our
review indicates that for some areas of
the globe (for example, Scandinavia,
China, the Sierra Nevada in California,
the Canadian Rockies and Tasmania), temperatures,
particularly in summer, appear to have been
higher during some parts of this period
than those that were to prevail until the
most recent decades of the twentieth century"
(p. 109).
- Hunt,
B.G. (2006) The
Medieval Warm Period, the Little Ice Age and
simulated climatic variability.- Climate
Dynamics, Volume 27, Numbers 7-8: 677-694, Dezember
2006.
- Abstract:
"The CSIRO Mark 2 coupled global climatic
model has been used to generate a 10,000-year
simulation for ‘present’ climatic
conditions. The model output has been analysed
to identify sustained climatic fluctuations,
such as those attributed to the Medieval
Warm Period (MWP) and the Little
Ice Age (LIA). Since no external forcing
was permitted during the model run all such
fluctuations are attributed to naturally
occurring climatic variability associated
with the nonlinear processes inherent in
the climatic system. Comparison of simulated
climatic time series for different geographical
locations highlighted the lack of synchronicity
between these series. The model was found
to be able to simulate climatic extremes
for selected observations for century timescales,
as well as identifying the associated spatial
characteristics. Other examples of time
series simulated by the model for the USA
and eastern Russia had similar characteristics
to those attributed to the MWP and the LIA,
but smaller amplitudes, and clearly defined
spatial patterns. A search for the frequency
of occurrence of specified surface temperature
anomalies, defined via duration and mean
value, revealed that these were primarily
confined to polar regions and northern latitudes
of Europe, Asia and North America. Over
the majority of the oceans and southern
hemisphere such climatic fluctuations could
not be sustained, for reasons explained
in the paper. Similarly, sustained sea–ice
anomalies were mainly confined to the northern
hemisphere. An examination of mechanisms
associated with the sustained climatic fluctuations
failed to identify a role for the North
Atlantic Oscillation, the El
Niño-Southern Oscillation
or the Pacific Decadal Oscillation.
It was therefore concluded
that these fluctuations were generated by
stochastic processes intrinsic to the nonlinear
climatic system. While a number of characteristics
of the MWP and the LIA could have been partially
caused by natural processes within the climatic
system, the inability of the model to reproduce
the observed hemispheric mean temperature
anomalies associated with these events indicates
that external forcing must have been involved.
Essentially the unforced climatic
system is unable to sustain the generation
of long-term climatic anomalies."
- La
Marche (1974): Paleoclimatic Inferences
from Long Tree-Ring Records.- Science 183,
1043-48
- LaMarche,
V. C. Jr & Stockton, C. W. (1974) Chronologies
from temperature-sensitive bristlecone pines
at upper treeline in western United States.-
Tree-Ring Bull. 34, 21–45. (cf. Bibliography
of the Bristlecone Pine)
- Loehle,
C. (2007)
A 2000-year global temperature reconstruction
based on non-treering proxies.- Energy &
Environment 18(7-8): 1049-1058.
- Abstract:
Historical data provide a baseline for judging
how anomalous recent temperature changes
are and for assessing the degree to which
organisms are likely to be adversely affected
by current or future warming. Climate histories
are commonly reconstructed from a variety
of sources, including ice cores, tree rings,
and sediment. Tree-ring data, being the
most abundant for recent centuries, tend
to dominate reconstructions. There are reasons
to believe that tree ring data may not properly
capture long-term climate changes. In this
study, eighteen 2000-year-long series were
obtained that were not based on tree ring
data. Data in each series were smoothed
with a 30-year running mean. All data were
then converted to anomalies by subtracting
the mean of each series from that series.
The overall mean series was then computed
by simple averaging. The mean time series
shows quite coherent structure. The
mean series shows the Medieval Warm Period
(MWP) and Little Ice Age (LIA) quite clearly,
with the MWP being approximately 0.3°C
warmer than 20th century values at these
eighteen sites."
Diskussion
der Publikation bei ClimateAudit
- Energy
& Environment (E&E) is altogether
probably not a peer-reviewed science publication
but (according to Indur
M. Goklany) it "has a section that
contains refereed papers and a section that
doesn"!
- Loehle,
C. & J.H. McCulloch (2008) Correction
to: A 2000-year global temperature reconstruction
based on non-treering proxies. Energy &
Environment 19(1): 93-100..
- Mann,
M.E., Z. Zhang, S. Rutherford, R. S. Bradley,
M. K. Hughes, D. Shindell, C. Ammann, G. Faluvegi
and N. Fenbiao (2009) Global
Signatures and Dynamical Origins of the Little
Ice Age and Medieval Climate Anomaly.- Science
326 no. 5957, pp. 1256-1260. [DOI: 10.1126/science.1177303].
(27 November 2009)
- Mann,
M.E. & Philip D. Jones (2003)
Global Surface Temperatures over the Past Two
Millennia.- Geophysical Research Letters,
Vol. 30, No. 15, 1820, August 2003, doi: 10.1029/2003GL017814
- Abstract:
"We present reconstructions of Northern
and Southern Hemisphere mean surface temperature
over the past two millennia based on high-resolution
'proxy' temperature data which retain millennial-scale
variability. These reconstructions indicate
that late 20th century warmth is unprecedented
for at least roughly the past two millennia
for the Northern Hemisphere. Conclusions
for the Southern Hemisphere and global mean
temperature are limited by the sparseness
of available proxy data in the Southern
Hemisphere at present."
Anmerkung zu Phil Jones, der
zum "Hockey-Stick-Team" der Climatic
Research Unit (CRU) der
University
of East Anglia (UEA), UK, gehört
(vgl.CRU
Staff undTyndall
Centre for Climate Change Research der
UEA, Science
Adviser Prof. H.J. Schellnhuber, gleichzeitig
Direktor
des PIK-Potsdam), und zur Transparenz
der verwendeten Daten allgemein von Steve
McIntyre:
"We've been working on this for
over 25 years. Why should we make our data
available to you?" "The
quotation comes from Phil Jones, in a refusal
to provide station data to Warwick Hughes.
Jones remains unrepentant and this refusal
is ongoing to this day."
Kommentar
von Steve
McIntyre at November 20, 2005 07:15
PM, in "sciencepolicy.colorado.edu",
der auf einer
eigenen Seite vorgestellt wird und unbedingt
lesenswert ist.
- Mann,
M.E., R.S. Bradley & M.K. Hughes (1998)
Global-Scale Temperature Patterns and Climate
Forcing Over the Past Six Centuries.- Nature,
No. 392, pp. 779-787, 1998
- McKitrick,
R. "What is the ‘Hockey Stick’
Debate About?" - (April 2004) Department
of Economics, University of Guelph (APEC Study
Group, Australia, April 4, 2003).
- Montford,
A.W. (2010) The
Hockey Stick Illusion: Climategate and the Corruption
of Science.- Independent Minds, Stacey Intl
(March 2010), Paperback.
- Ngomanda,
N., A. Chepstow-Lusty, M. Makaya, P. Schevin,
J. Maley, M. Fontugne, R. Oslisly, N. Rabenkogo,
and D. Jolly (2005) Vegetation
changes during the past 1300 years in western
equatorial Africa: a highresolution pollen record
from Lake Kamalee, Lope Reserve, Central Gabon.-
The Holocene, Vol. 15, No. 7, 1021-1031,
- Abstract:
"Vegetation changes during the past
1300 years are reconstructed in western
equatorial Africa using a high-resolution
pollen record from Lake Kamalete This small
marshy basin (c. 5-7 ha) is located in forest-savanna
mosaic in Lope Reserve (043'S, 116'E), central
Gabon. The Kamalete pollen data show the
persistence over the past 1300 years of
a relatively stable forest-savanna mosaic,
associated with significant changes of the
forest component. Three successive stages
of forest dynamics occurred. First, at 1325
cal. BP, moist semi-evergreen rainforest
existed around the catchment of Lake Kamalete.
However, it appears from the consistent
presence of > 70% Gramineae pollen that
the site was always primarily in savanna.
Secondly, from c. 1240 to 550 cal BP, a
noticeable increase in shade-intolerant
plant species indicate openings in the rainforest
canopy. The persistence of gap-colonizer
species, such as Macaranga, Tetrorchidium
and Musanga for several centuries in the
rainforest, is explained by recurring canopy
disturbance associated with shifts in available
moisture. These hydrological changes may
be related to a succession of longer and
more severe dry seasons than observed today.
Thirdly, at 550 cal BP, mature forest was
re-established, corresponding to progressive
savanna colonization by forest pioneer species
such as Aucoumea klaineana, Lophira alata
and Fagara macrophylla. This new phase of
forest expansion coincided with a marked
lithological change, indicating an increase
in lake-level. It
is concluded that the major vegetation changes
observed are due to climatic variability,
and anthropogenic action had limited influence."
-
NOAA Paleoclimatology Program archives reconstructions
of past
climatic conditions derived from paleoclimate
proxies, in addition to the Program's large
holdings of primary paleoclimatic proxy data.
Included are reconstructions of past temperature,
precipitation, vegetation, streamflow, sea surface
temperature, and other climatic or climate-dependent
conditions.
- S.
Redner, S. & M.R. Petersen (2006) On
the Role of Global Warming on the Statistics
of Record-Breaking Temperatures.- Phys. Rev.
E 74, 061114 (14 ppp.)
- Abstract:
"We theoretically study the statistics
of record-breaking daily temperatures and
validate these predictions using both Monte
Carlo simulations and 126 years of available
data from the city of Philadelphia. Using
extreme statistics, we derive the number
and the magnitude of record temperature
events, based on the observed Gaussian daily
temperature distribution in Philadelphia,
as a function of the number of years of
observation. We then consider the case of
global warming, where the mean temperature
systematically increases with time. Over
the 126-year time range of observations,
we argue that the current warming rate is
insufficient to measurably influence the
frequency of record temperature events,
a conclusion that is supported by numerical
simulations and by the Philadelphia data.
We also study the role of correlations between
temperatures on successive days and find
that they do not affect the frequency or
magnitude of record temperature events."
- Storch
et al. (2004)
Reconstructing
Past Climate from Noisy Data.- Science,
Vol. 306. no. 5696, pp. 679 - 682 (22 October
2004) - Zusammenfassung vom GKSS: "Temperaturschwankungen
des letzten Millenniums wahrscheinlich größer
als bisher angenommen", mit neu
berechneter Kurve nicht mehr online
[last
date of access: 20.08.2019]
- Abstract:
"Empirical reconstructions of the Northern
Hemisphere (NH) temperature in the past
millennium based on multiproxy records depict
small-amplitude variations followed by a
clear warming trend
in the past two centuries. We use
a coupled atmosphere-ocean model simulation
of the past 1000 years as a surrogate climate
to test the skill of these methods, particularly
at multidecadal and centennial time scales.
Idealized proxy records are represented
by simulated grid-point temperature, degraded
with statistical noise. The centennial variability
of the NH temperature is underestimated
by the regression-based methods applied
here, suggesting that past variations may
have been at least a factor of 2 larger
than indicated by empirical reconstructions."
-
View
Full Text [date
of access: 20.08.2019]
- "Übliche
Methoden zur Rekonstruktion vergangener
Klimaveränderungen, die auf der Analyse
von sogen. Proxydaten
für das Paläoklima (u. a. von
Baumringen, Korallen und Eiskernen) beruhen,
unterschätzen wahrscheinlich die tatsächlichen
Temperaturschwankungen um einen Faktor bis
zu 2, möglicherweise sogar noch mehr.
(...) Die vorgestellte Studie stellt eine
Neuabschätzung der vergangenen Temperatur-Schwankungen
dar. Sie stellt weder Behauptungen in Frage
hinsichtlich der Identifizierung von Signalen
der von Menschen gemachten Klimaänderungen
in den letzten Jahrzehnten, die auf der
Geschwindigkeit der Veränderungen beruhen,
noch hinsichtlich wahrscheinlicher oder
möglicher zukünftiger Klimaänderungen."
- PAGES
2k *
Consortium (2013) Continental-scale
temperature variability during the past two
millennia.- Nature Geoscience volume
6, pages 339–346.
- Abstract:
"Past global climate changes had strong
regional expression. To elucidate their
spatio-temporal pattern, we reconstructed
past temperatures for seven continental-scale
regions during the past one to two millennia.
The most coherent feature in nearly all
of the regional temperature reconstructions
is a long-term cooling trend, which ended
late in the nineteenth century. At multi-decadal
to centennial scales, temperature variability
shows distinctly different regional patterns,
with more similarity within each hemisphere
than between them. There were no globally
synchronous multi-decadal warm or cold intervals
that define a worldwide Medieval Warm Period
or Little Ice Age, but all reconstructions
show generally cold conditions between ad
1580 and 1880, punctuated in some regions
by warm decades during the eighteenth century.
The transition to these colder conditions
occurred earlier in the Arctic, Europe and
Asia than in North America or the Southern
Hemisphere regions. Recent
warming reversed the long-term cooling;
during the period ad 1971–2000, the
area-weighted average reconstructed temperature
was higher than any other time in nearly
1,400 years."
- *:
Das internationale PAGES 2k Forscherteam
hat für die sieben Kontinentalregionen
Arktis, Antarktis, Nordamerika, Südamerika,
Europa, Asien und Australien/Südostasien
das Klima der letzten 2000 Jahre rekonstruiert.
Siehe auch:
Geesthachter
Wissenschaftler rekonstruieren das Klima
der Vergangenheit mit einer Zusammenfassung.
[date
of access: 20.08.2019]
- The
PAGES-2k synthesis: Guest
commentary by Darrell Kaufman (N. Arizona
U. in RealClimate - (2013)
[date of access: 20.08.2019]
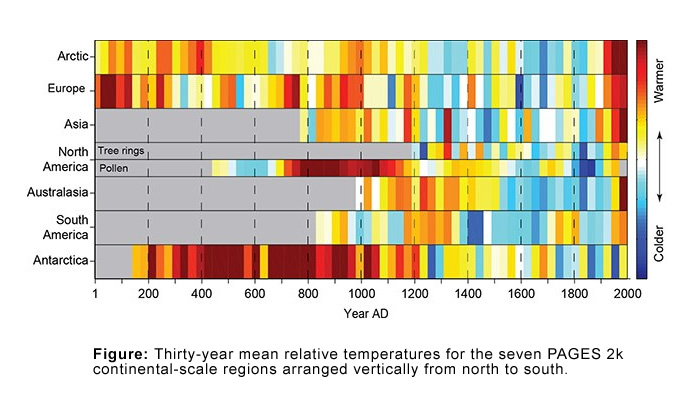
Abb.
A2-24/10:
aus The
PAGES-2k synthesis Guest
commentary by Darrell Kaufman (N. Arizona
U.
- Siehe
auch die generelle Frage:
Ist politisierte Klimaforschung noch ergebnisoffen?
Die Website (
Klimanotizen)
eines aufmerksamen und kritischen Beobachters
(kein Klimatologe), mit vielen Fakten und Zitaten,
u.a.: Die Verfechter der Sonnentheorie beklagen
Denkverbote durch die tonangebende CO2
- Fraktion.
"Der
Einfluss der Sonne ist ein Tabuthema",
kritisierte bereits vor 20 Jahren die Stratosphären-Expertin
Prof.
Dr. Karin Labitzke von der Freien
Universität Berlin. Sie beklagte
(und daran hat sich bisher nichts geändert):
"Wenn wir davon reden, wird uns
sogleich vorgeworfen, wir seien auch gegen
das Energiesparen." (Spiegel
23/2001: "Klima. Die Launen der Sonne").
-
 UK
(C4) Documentary The Great Global Warming Swindle
- (
nicht
mehr bei GOOGLE - sehr umstritten)
UK
(C4) Documentary The Great Global Warming Swindle
- (
nicht
mehr bei GOOGLE - sehr umstritten)
According to a group of scientists brought together
by documentary-maker Martin Durkin, if the planet
is heating up, it isn't your fault ... British
TV, Channel 4, Länge des Videos (englisch):
1 Std. 13 Min. 32 Sek.
- 08.03.2007 - es lohnt sich, den Film anzuschauen.
"Zwei Dutzend durchaus namhafte Klima-
und Wetterforscher – unter ihnen auch IPCC-Autoren
selbst – kommen in dem (...) Streifen zu
Wort."
Besprechung in
WELT-Online.
(sehr
umstritten)
- "Global
Warming Doomsday Called Off" -Top Documentary
Films 43 Min. 59 Sek.
-
"In this eye-opening documentary viewers
will discover how the most respected researchers
from all over the world explode the doom and
gloom of global warming. Humans stand accused
of having set off a global climate catastrophe
by increasing the amount of carbon dioxide in
the atmosphere. The prophecy of doom is clear
and media pass on the message uncritically.
Now serious criticism has arisen from a number
of heavyweight independent scientists. They
argue that most of the climatic change we have
seen is due to natural variations. They also
state that if CO2 is to play a role
at all -it will be minuscule and not catastrophic!
This story presents a series of unbiased scientists
as our witnesses. We will hear their eloquent
criticism of the IPCC conclusions illustrated
by coverage of their research work."
Hören
und sehen Sie hier namhafte Kritiker der
CO2
- Hypothese und
bilden Sie sich selbst eine Meinung!
(sehr
umstritten)
- "Public
Misperceptions of Human-Caused Climate Change:
The
Role of the Media" -
900 KB, 25 S.
Von Prof. Bob Carter (Marine Geophysical Laboratory
at James Cook University, Australia), Committee
on Environment and Public Works, Unites States
Senat, mit vielen Abb. und Grafiken. -
(sehr
umstritten)
-
Hocky
Sticks & Ancient Pine Trees (Infos
zum Lebensraum von
Pinus
longaeva)
-
Climate
Audit (Webpages
von Stephen McIntyre)
-
RealClimate
website (Michael
Mann u.a., Verteidiger der Hockey-Schläger-Kurve
und führende Klimaforscher des IPCC, inkl.
Stefan Rahmstorf vom PIK in Potsdam)
-
Risse
im Klima-Konsens, von MARCEL CROK, Technology
Review 03/2005, Report
- Eine
ausführliche Zusammenfassung der unterschiedlichsten
Rekonstruktionen der Temperaturentwicklung
in den letzten 1000 bis 2000 Jahren, inkl. Methodenbeschreibung
und The "Hockey stick controversy",
finden Sie bei
Wikipedia.
-
Der
Wegman-Report: Eine sehr ausführliche,
sachliche und qualifizierte Auseinandersetzung
mit den statistischen Methoden, die zur Entwicklung
der Mannschen Hockeystick-Kurve geführt
haben. Dem Wegman-Report wird gerne vorgeworfen,
an ihm hätten keine Klimatologen mitgearbeitet.
Das ist aber für eine Überprüfung
mathematisch-statistischer Methoden auch gar
nicht notwendig. Es lohnt sich, diesen Bericht
sehr gründlich zu lesen, um die Fragwürdigkeit
der MBH98/99 - Publikationen zu verstehen.
-
1.223 KB, 92
S.
Kurzfassung
-
87 KB, 2 S.
- Edward
Wegman:
"THE CV OF A DENIER
Edward Wegman received his Ph.D. degree in mathematical
statistics from the University of Iowa. In 1978,
he went to the Office of Naval Research, where
he headed the Mathematical Sciences Division
with responsibility Navy-wide for basic research
programs. He coined the phrase computational
statistics, and developed a high-profile research
area around this concept, which focused on techniques
and methodologies that could not be achieved
without the capabilities of modern computing
resources and led to a revolution in contemporary
statistical graphics. Dr. Wegman was the original
program director of the basic research program
in Ultra High Speed Computing at the Strategic
Defense Initiative's Innovative Science and
Technology Office. He has served as editor or
associate editor of numerous prestigious journals
and has published more than 160 papers and eight
books." (aus: "Statistics
needed", National Post, Lawrence Solomon,
2007)
[Beitrag mittlerweile offline]
|
|
|
| |
| Weiterführende
Links zum Thema "Global Warming" etc.
innerhalb dieser Website ( nur
kurze Hinweise!): |
| |
 Das zyklische Auftreten von Kalt- und Warmzeiten
im Laufe der Erdgeschichte.
Das zyklische Auftreten von Kalt- und Warmzeiten
im Laufe der Erdgeschichte.
Das
zyklische Auftreten Warm- und Kaltzeiten (150 Mio.
Zykluszeit / Eis-Zeitalter)
Das
zyklische Auftreten Warm- und Kaltzeiten (125.000.
Zykluszeit / Eiszeit-Zyklus)
Klimaschwankungen
im Jungpleistozän und Holozän und Vegetationsgeschichte
Kurzer
Überblick zur Klimageschichte
Literaturangaben
zur Klimageschichte, kleine Auswahl
Globalklimatische
Grundlagen und Entstehung von Vegetationszonen
Die
glaziale und postglaziale Vegetationsgeschichte
Afrikas
Postglaziale
aride und humide Phasen in der Sahara Afrikas
Meeresspiegel
während des LGM (120m unter NN) u. Simulation
um +5m ü.NN
Glaziale
bis postglaziale Nordseegeschichte
Entwicklung
der Insel Sylt
Holozäne
Optima und Pessima
2000
Jahre Temperaturentwicklung der nördlichen
Hemisphäre, Bemerkungen zum "Hockeystick"
Sargasso
Sea Surface Temperature (3000 BP - Present)
Der
sogenannte Treibhauseffekt
Hurrikane
haben nicht immer Saison
Elektromagnetisches
Spektrum, Strahlungsenergie und Absorption
Die
Bedeutung von Kohlendioxid
Der
Kohlenstoffkreislauf - Ein kleiner Einblick
Das
zyklische Auftreten von Sonnenzyklen |
| |
Freundlicher
Hinweis:
Wenn Sie
Inhalte dieser Website zitieren oder diskutieren,
was sehr erwünscht ist, bitte verfälschen
Sie nicht die Inhalte durch unvollständige
Zitate bzw. reissen Sie die Inhalte nicht aus dem
Zusammenhang, und bitte geben Sie die Quellen richtig
und vollständig an. |
|
| |
 |
| |
|
Copyright
© Harald Kehl
ehemals TU-Berlin - Institut für Ökologie
|
| |


|
| |
|
|
|
| |
|
|
|
|