| |
|
|
|
|
|
|
| |
|
|
|
|
| |
|
- Die
verschiedenen
Zyklen können sich überlagern und zeichnen
sich selbst durch starke Schwankungen in ihrer Intensität
aus.
|
|
 |
|
| |
|
|
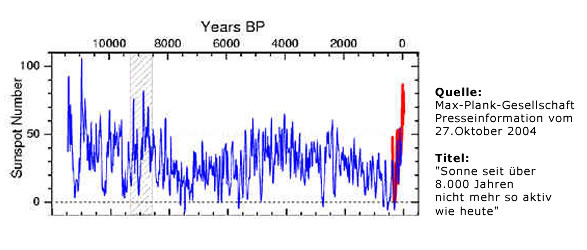
 Abb. A2-27/01:
Aus:  Max-Planck-Gesellschaft
- Presseinformation vom 27. Oktober 2004 -
Max-Planck-Gesellschaft
- Presseinformation vom 27. Oktober 2004 -
 4
S 4
S
[date of access: 30.03.07]
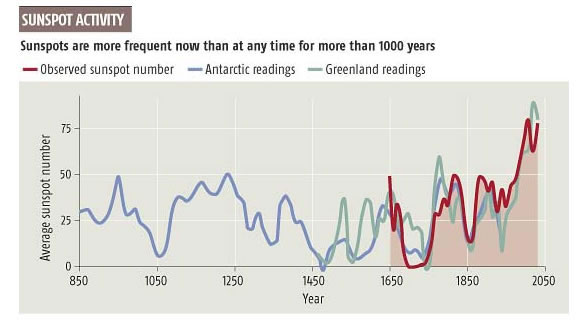
"Aus
C14-Daten rekonstruierte Sonnenfleckenzahlen (10-Jahres-Mittelwerte)
für die vergangenen 11.400 Jahre (blaue Kurve) und die
direkt beobachteten Sonnenfleckenzahlen seit 1610 (rote Kurve).
Die verlässlichen C14-Daten enden 1900, so dass der starke
Anstieg der Sonnenaktivität im 20. Jahrhundert dort nicht
in Erscheinung tritt. Die Rekonstruktion zeugt deutlich, dass
ein vergleichbarer Zeitraum hoher Sonnenaktivität mehr
als 8.000 Jahre zurückliegt."
Bild aus MPI für Sonnensystemforschung, in:
|
|
| |
|
 Vgl.
Solanki et al.
2004 und nächste Abb. aus der gleichen Publikation,
Original aus NATURE! Vgl.
Solanki et al.
2004 und nächste Abb. aus der gleichen Publikation,
Original aus NATURE! |
|
|
|
| |
|
 |
|
| |
|
|
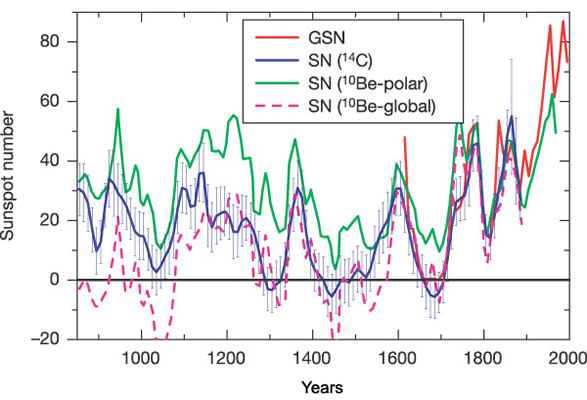
Abb. A2-27/02:
Aus "Unusual activity of the Sun during recent
decades compared to the previous 11,000 years" by S.
K. Solanki, I. G. Usoskin, B. Kromer, M. Schüssler and
J. Beer.- Nature
431, 1084-1087(28 October 2004) doi:10.1038/nature02995.
(FIG.
2 aus Solanki et al.) Comparison
between directly measured sunspot number (SN) and SN reconstructed
from different cosmogenic isotopes.
"Plotted are SN reconstructed from Delta 14C (blue),
the 10-year averaged group sunspot number1 (GSN, red) since
1610 and the SN reconstruction 14 from 10Be under the two
extreme assumptions of local (green) and global (magenta,
dashed) production, respectively. The slightly negative
values of the reconstructed SN during the grand minima are
an artefact; they are compatible with SN = 0 within the
uncertainty of these reconstructions as indicated by the
error bars. Delta14C is connected with the 14C production
rate via a carbon cycle model21. The connection between
the 14C production rate, R, and the cosmic ray flux is given
by where
theta is the colatitude relative to the geomagnetic dipole
axis, and Pc (theta, M) is the local cosmic ray rigidity
cutoff (which depends on theta and the virtual geomagnetic
dipole moment, M)23. X(P, Phi) is the differential cosmic
ray rigidity spectrum near Earth, Phi is the modulation
strength describing the average rigidity losses of cosmic
rays inside the heliosphere, Y(P) is the differential yield
function 24 of 14C, and P is the rigidity of the primary
cosmic rays.
For
studies of long-term changes of the cosmic ray flux, the
parameter Phi alone adequately describes the modulation
of the cosmic ray spectrum X(P)11,24. The two most abundant
cosmic ray species, protons and alpha-particles, are taken
into account in the model13. The cosmic ray transport model
relates R to Phi, which in turn depends on the Sun's open
magnetic flux12.
The
open flux is linked with the magnetic flux in sunspots (and
thus with the SN) via the source term in a system of differential
equations9,10. The value of R is obtained from Delta14C
and M is known for the whole interval of interest 25,26,
so that Phi can be obtained from the inversion of the equation
given above. Error bars depict the 68% confidence interval
for the reconstructed SN, which takes into account both
random and systematic uncertainties."
|
|
| |
|
| Siehe
dazu auch: Aktueller Stand der Forschung |
|
| |
|
 |
|
| |
|
Abb. A2-27/03:
Quelle / Sourcenewscientist.com
- [not longer online] Vgl. Sie auch:
Solar
and Heliospheric Observatory und
die folgenden Abbildungen unten mit den Sonnenfleckenrelativzahlen
zwischen 1600 und 2000 A.D.
[date of access: 18.01.07] |
|
| |
|
|
|
| |
|
 |
|
| |
|
|
Abb. A2-27/04:
Die Zahl der Sonnenflecken schwankt
in einem regelmässigen Zyklus von etwa 11 Jahren, welche
in Gruppen auftreten (Gleissberg-Zyklen - 80-90 Jahre). Die
Maxima sind unterschiedlich stark ausgeprägt. In der
zweiten Hälfte des 17. Jahrhunderts war die Sonne fast
fleckenlos (H.Wöhl, Kiepenheuer-Institut für Sonnenphysik,
Freiburg, verändert und ergänzt nach University
of Nebraska-Lincoln, Natural Resources)."
Ursprünglich
aus:  Schmitt,
D. & M. Schüssler (2002), S. 4, farblich verändert.
Die Zyklen wurden seit ca. 1749 gezählt. Um das Jahr
2000 wurde der Zyklus 23 durchlaufen. Im März 2008 beginnt
der Zyklus 24, welcher evtl. die gleiche Sonnenfleckenrelativzahl
haben kann wie die Zyklen 3, 18, 21 oder 22. Andere
Berechnungen gehen davon aus
[not
longer online] ,
dass 23 und 24 wohl ähnlich sein werden. Siehe unten! Schmitt,
D. & M. Schüssler (2002), S. 4, farblich verändert.
Die Zyklen wurden seit ca. 1749 gezählt. Um das Jahr
2000 wurde der Zyklus 23 durchlaufen. Im März 2008 beginnt
der Zyklus 24, welcher evtl. die gleiche Sonnenfleckenrelativzahl
haben kann wie die Zyklen 3, 18, 21 oder 22. Andere
Berechnungen gehen davon aus
[not
longer online] ,
dass 23 und 24 wohl ähnlich sein werden. Siehe unten!
|
|
|
|
| |
|
 |
|
| |
|
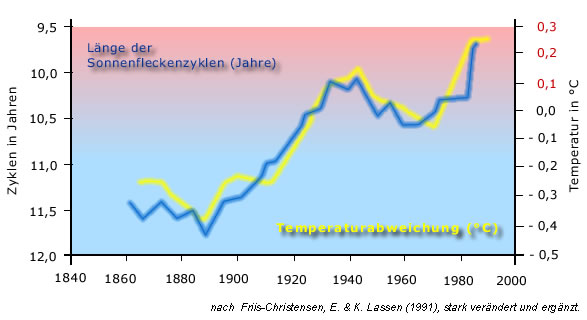
Abb. A2-27/05:
"Die Länge der Sonnenfleckenzyklen zeigt eine auffallende
Ähnlichkeit mit der Temperaturveränderung zwischen
1860 und 1980". Aus Friis-Christensen,
E. & K. Lassen (1991), stark verändert und ergänzt.
Beachten Sie jedoch bitte die Anmerkungen
weiter unten.
|
|
| |
|
|
|
|
|
|
|
Anmerkung
1:
Die
Aussagen von Friis-Christensen
und Lassen (1991) in Science sind mittlerweile umstritten
und waren z.B. nach Auffassung von Beer
(2004), siehe unten
Lit.-Angabe! eher
"ambitiöse Interpretationen" Gleichwohl
waren die Hinweise sehr wichtig und haben die Notwendigkeit
weiterer Forschungen in diese Richtung deutlich gemacht.
Mittlerweile hat es hier einige Korrekturen gegeben, die
vor allem die Daten-Interpretation der letzten 30 Jahre
betrifft (vgl. Lassen 1997, siehe
Lit.-Angabe
unten!).
Andererseits
scheint heute kein Zweifel mehr dahingehend zu bestehen,
dass wenigstens vor Mitte der 70er Jahre die Sonne eine
entscheidende Rolle bei der Temperaturentwicklung gespielt
hat. Damit wird die Bedeutung von CO2 für
die "post LIA-Phase" stark relativiert (nicht
negiert). Exogene Faktoren spielen aber offensichtlich eine
weitaus grössere Rolle als von den Befürwortern
der AGW-Hypothese bisher akzeptiert.
Anmerkung
2: Siehe dazu auch den vielfach aufschlussreichen Film:
Das
Geheimnis der Wolken.
Eine ARTE-Sendung
von 2008 in 5 Teilen auf YouTube, oder
die
Ganze Doku (auf
YouTube, 52 Min) - Klimawandel durch Sonne, kosmische Strahlung
& Wolkenbildung.
Eine
populärwissenschaftliche Abhandlung finden Sie hier:
Henrik Svensmark & Nigel Calder (2008) Sterne steuern
unser Klima.- Patmos, 251 Seiten, 24,90 Euro.
|
|
|
|
| |
|
 |
|
| |
|
Abb. A2-27/06:
Laboratory for Atmospheric and Space Physics, University of
Colorado at Boulder: LASP
over longer periods of time. Measuring solar
variability SIM and Sorce |
|
| |
|
| "How
does the variation in sunspot number (easy
to see and measure) relate to variation in UV flux (the
quanity that matters for atmospheric photochemisty)? This is
a tricky issue - we have to develop "proxies" - quantities
we can measure now and compare with the current UV output of
the Sun and then go back to historic measurements (e.g. from
rocks, icecores, tree logs, etc) of these proxies" |
|
| |
|
|
Anmerkung:
- Wie
Ende des 20. und zu Beginn des 21. Jahrhunderts ein sogenanntes
"Modernes Minimum" herausgelesen werden kann,
ist nicht so leicht nachzuvollziehen. Zyklus 23 (siehe oben!)
zeigt bestenfalls eine Abschwächung auf hohem Niveau.
Vgl. Solanki et al. (2004), MPG
2004 und auch die nächste Abb. des LASP mit der
TSI (Reconstructed Total Solar Irradiance). Im übrigen
müsste dann wesentlich eher von einem "Minimum"
um 1900 (Krakatao-Ausbruch) gesprochen werden. Um ein Minimum
im eigentlichen Sinne, d.h. ein Minimum solarer Aktivität,
handelte es sich aber mitnichten.
|
|
| |
|
|
Nachtrag:
- Neuere
Beobachtungen zeigen tatsächlich eine signifikante
Abschwächung der Sonnenfleckenaktivität zu Beginn
des 21.Jh. (einhergehend mit einer Stagnation
bis Rückläufigkeit der "globalen Temperaturen").
Die Bedeutung von Zyklus 24 wurde von Hathaway & Wilson
(2006) - siehe unten! - überschätzt. Aber auch
von Ihnen wurde für die erste Hälfte des 21. Jh.
ein Rückgang der Sonnenfleckenaktivität prognostiziert.
Jedoch sollte erst der Zyklus 25 - ab etwa 2020 - ihren
Berechnungen zufolge extrem schwach ausfallen.
|
|
| |
|
| |
|
 |
|
| |
|
|
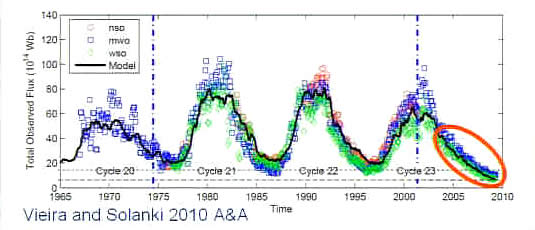
Abb. A2-27/07:
Laboratory for Atmospheric and Space Physics, University of
Colorado at Boulder: LASP
over longer periods of time Measuring
Earth's surface temperature and solar radiation.
"After accounting for the increase in CO2 and other
greenhouse gases, the
Earth’s surface temperature corresponds with the increase
in solar radiation, except during major volcanic eruptions"
|
|
| |
|
|
|
| |
|
 |
|
| |
|
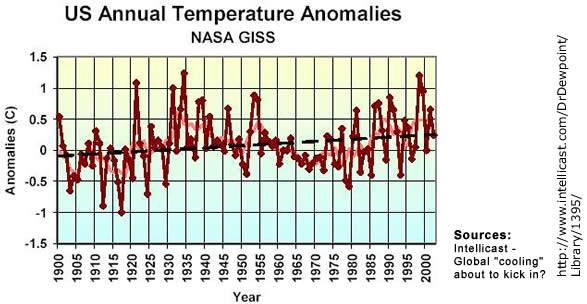
Abb. A2-27/08:
University of Nebraska-Lincoln, Natural Resources. - Intellicast
- Global "cooling" about to kick in? "
Relation to Solar Cycle: 'Global Warming' and Solar Flux: Warming"
[date of access: 16.04.07, Website mittlerweile offline, 15.11.2019]
"The
periods of warming shown above also coincide nicely with the
stronger eleven year solar cycles shown
(above). The
cooler periods during the last one hundred years or so correspond
with the weaker solar cycles of the last one hundred years.
Thus it seems that the sun is a factor in the global temperatures
and the stronger cycles of late may be a significant factor
in recent global warming."
|
|
|
|
| |
|
 |
|
| |
|
Abb. A2-27/09:
Science@NASA -
Scientists
Predict Big Solar Cycle vom 21. Dezember 2006, aus Hathaway,
D. H. and Wilson, R. M. (2006) "Geomagnetic activity indicates
large amplitude for sunspot cycle 24", Geophys. Res. Lett.
|
|
| |
|
|
"According
to their analysis (Hathaway and Wilson's prediction for the
amplitude of Solar Cycle 24), the next Solar Maximum should
peak around 2010 with a sunspot number of 160 plus or minus
25. This would make it one of the strongest solar cycles of
the past fifty years - which is to say, one of the strongest
in recorded history. [Eine
Einschätzung, die bisher noch weit
neben der Realität liegt, Anm. Verfasser, 07.03.2010]
Astronomers
have been counting sunspots since the days of Galileo, watching
solar activity rise and fall every 11 years. Curiously, four
of the five biggest cycles on record have come in the past
50 years. "Cycle 24 should fit right into that pattern,"
says Hathaway.
These
results are just the latest signs pointing to a big Cycle
24. Most compelling of all, believes Hathaway, is the
work of Mausumi Dikpati and colleagues at the National Center
for Atmospheric Research (NCAR) in Boulder, Colorado. "They
have combined observations of the sun’s 'Great Conveyor
Belt' with a sophisticated computer model of the sun’s
inner dynamo to produce a physics-based prediction of the
next solar cycle." In short, it's going to be intense.
Details may be found in the Science@NASA story Solar Storm
Warning."
"Hathaway
points out that there are actually two types of geomagnetic
activity:
(1)
storms caused by the gentle buffeting of solar wind streams
and
(2) storms caused by the more forceful impact of flares
and coronal mass ejections (CMEs).
Only
the first type has predictive value," says Hathaway.
"Storms caused by solar wind streams come and go in a
regular pattern that foretells the solar cycle. Storms caused
by flares and CMEs don't have this property."
To
improve their results, Hathaway and Wilson used a technique
developed by Joan Feynman to remove storms caused by flares
and CMEs from their data.
|
|
| |
|
|
Anmerkung:
- Zu
den Prognosen von Hathaway & Wilson (2006) vgl.
Sie bitte die Angaben zum aktuellen Stand
der Forschung, speziell Solanki et al. (2009)
und Vieira & Solanki (2010), wonach der Zyklus
24 evtl. nur sehr schwach ausgeprägt, oder sehr spät
auftreten wird.
|
|
|
|
| |
|
 |
|
| |
|
|
Abb. A2-27/10:
"Long Range Solar Forecast - Solar Cycle 25 peaking around
2022 could be one of the weakest in centuries",
vom 05.10.2006 / Author: Dr. Tony Phillips | Production Editor:
Dr. Tony Phillips | Credit: Science@NASA
|
|
| |
|
|
"In
red, David Hathaway's predictions for the next two solar cycles
and, in pink, Mausumi Dikpati's prediction for cycle 24.
On
the other hand, they will have to worry more about cosmic
rays. Cosmic rays are high-energy particles from deep space;
they penetrate metal, plastic, flesh and bone. Astronauts
exposed to cosmic rays develop an increased risk of cancer,
cataracts and other maladies. Ironically, solar explosions,
which produce their own deadly radiation, sweep away the even
deadlier cosmic rays. As flares subside, cosmic rays intensify
- yin, yang.
Hathaway's
prediction should not be confused with another recent forecast:
A team led by physicist Mausumi Dikpata of NCAR [vgl.
Lit. unten!] has predicted that Cycle 24, peaking
in 2011 or 2012, will be intense. Hathaway
agrees: "Cycle 24 will be strong. Cycle 25 will be weak.Both
of these predictions are based on the observed behavior of
the conveyor belt."
Anthony
Watts (Jan. 25, 2012)
First
Estimate of Solar Cycle 25 Amplitude – may be the smallest
in over 300 years.- WUWT.
|
|
| |
|
| |
|
| |
|
| Vgl.
Sie in der nächsten Abbildung unten auch die aktuellen
- und korrigierten - Voraussagen (Sunspot Number Prediction
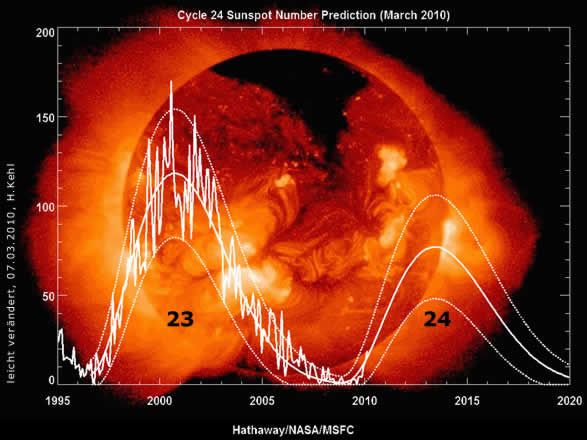
- March 2010) von Hathaway / NASA / MSFS: |
|
| |
|
 |
|
| |
|
Abb. A2-27/11:
NASA,
Solar Physics, Marshall Space Flight Center, The Sunspot
Cycle (Updated 2010/03/02) |
|
| |
|
Sunspot
Cycle Predictions:
"MSFC Solar Physics Branch members Wilson, Hathaway, and
Reichmann have studied the sunspot record for characteristic
behavior that might help in predicting future sunspot activity.
Our current predictions of solar activity for the next few years
can be found at this link.
Although sunspots themselves produce only
minor effects on solar emissions, the magnetic activity that
accompanies the sunspots can produce dramatic changes in the
ultraviolet and soft x-ray emission levels. These changes over
the solar cycle have important consequences for the Earth's
upper atmosphere."
|
|
| |
|
 |
|
| |
|
 |
Stand
der Forschung: |
|
|
| |
|
 Weitere,
umfangreiche Literatur
zum Thema "Sonnenaktivität" auf eigener
Seite und
extern
auf Topics of Science.gov.
Weitere,
umfangreiche Literatur
zum Thema "Sonnenaktivität" auf eigener
Seite und
extern
auf Topics of Science.gov. |
|
| |
|
|
|
|
| |
|
|
Esp.
the next two contributions of:
|
|
| |
|
|
Solanki, S.K., N.A. Krivova & L.E. Vieira (2009)
Solar magnetic field and irradiance: How unusual is the current
minimum?
AGU
Fall Meeting, 14 - 18 Dec. 2009, San Francisco, USA
[leider
nicht mehr direkt online]
|
|
| |
|
|
McCracken, F.B. McDonald, J. Beer, J. Abreu & F. Steinhilber
(2009) The effects of low solar activity upon the cosmic
radiation and the interplanetary magnetic field over the past
10,000 years, and implications for the future.
AGU
Fall Meeting, 14 - 18 Dec. 2009, San Francisco, USA. [date
of access: 22.02.2010, [leider
nicht mehr direkt online]
Friedhelm
Steinhilber and Jürg Beer (2013)
Prediction
of solar activity for the next 500 years.- Journal
of Geophysical Research: Space Physics, Volume 118, Issue
5.
|
|
| |
|
|
Balmaceda, L., N.A. Krivova & S.K. Solanki (2007) Reconstruction
of solar irradiance using the Group sunspot number.-
Advances in Space Research 40: 886-989.[last
date of access: 15.11.2019]
|
|
| |
|
"Abstract:
We present a reconstruction of total solar irradiance since
1610 to the present based on variations of the surface distribution
of the solar magnetic .eld. The latter is calculated from the
historical record of the Group sunspot number using a simple
but consistent physical model. Our model successfully reproduces
three independent data sets: total solar irradiance measurements
available since 1978, total photospheric magnetic .ux from 1974
and the open magnetic .ux since 1868 (as empirically reconstructed
from the geomagnetic aaindex). The model predicts an increase
in the total solar irradiance since the Maunder Minimum of about
1.3 Wm²." |
|
| |
|
|
Beer, J. (2004)
Kosmische
Strahlung und Wolken.- EAWAG news 58 |
|
| |
|
|
Friis-Christensen, E. & H. Svensmark (1997) What
do we really know about the Sun-climate connection? - Advances
in Space Research, Volume 20, Issue 4-5, p. 913-921. |
|
| |
|
|
Lassen, K. (1997)
Long-term Variations in Solar Activity and their Apparent Effect
on the Earth's Climate.- Tekniske rapporter fra No. 97-11. |
|
| |
|
|
Mausumi Dikpati, Giuliana de Toma & Peter A. Gilman (2006)
Predicting The Strength Of Solar Cycle 24 Using A Flux-transport
Dynamo-based Tool.- Geophys. Res. Lett., 33, L05102, doi:10.1029/2005GL025221 |
|
| |
|
|
Willson, Richard C., and Alexander V. Mordvinov (2003)
Secular
Total Solar Irradiance Trend During Solar Cycles 21-23.-
Geophysical Research Letters 30: 1199-1202. |
|
| |
|
|
Vieira, L. E. A. & S. K. Solanki (2010)
Evolution
of the solar magnetic flux on time scales of years to millenia.-
A&A Volume 509, 13 pp., January 2010, Published Online:
26 January 2010. [date
of access: 25.02.10]
|
|
| |
|
|
|
|
| |
|
Abb. A2-27/12:
Aus: Vieira & Solanki (2010) Evolution of the
solar magnetic flux on time scales of years to millenia.- A&A
Volume 509, 13 pp. |
|
| |
|
|
"Abstract:
Aims.
We improve the description of the evolution of the Sun's open
and total magnetic flux on time scales of years to millenia.
Methods.
In the model employed here the evolution of the solar total
and open magnetic flux is computed from the flux emerging
at the solar surface in the form of bipolar magnetic features,
which is related to the sunspot number cycle parameters and
can be estimated from historical records. Compared to earlier
versions of the model in addition to the long-lived open flux,
now also a more rapidly decaying component of the open flux
is considered. The model parameters are constrained by comparing
its output with observations of the total surface magnetic
flux and with a reconstruction of the open magnetic flux based
on the geomagnetic indexes. A method to compute the Sun's
total magnetic flux and the sunspot number during the Holocene,
starting from the open flux obtained from cosmogenic isotopes
records, is also presented.
Results.
By considering separately a rapidly evolving and a slowly
evolving component of the open flux the model reproduces the
Sun's open flux, as reconstructed based on the aa-index, much
better and a reasonable description of the radial component
of interplanetary magnetic field data is obtained. The greatest
improvement is in the reproduction of the cyclic variation
of the open flux, including the amplitudes of individual cycles.
Furthermore, we found that approximately 25% of the modeled
open flux values since the end of the Maunder minimum are
lower than the averaged value over 2008, i.e. during the current
low minimum. The same proportion is observed in reconstructions
of the open flux during the Holocene based on cosmogenic isotopes,
which suggests that the present solar minimum conditions are
below average, but not exceptional in terms of the heliospheric
magnetic flux."
|
|
| |
|
Science
News, (June 9, 2008)
The
sun has been lying low for the past couple of years, producing
no sunspots and giving a break to satellites.
|
|
| |
|
| "
That's good news for people who scramble when space weather
interferes with their technology, but it became a point of discussion
for the scientists who attended an international solar conference
at Montana State University. Approximately 100 scientists from
Europe, Asia, Latin America, Africa and North America gathered
June 1-6 to talk about "Solar Variability, Earth's Climate
and the Space Environment." |
|
| |
|
Weitere,
umfangreiche Literatur
zum Thema "Sonnenaktivität"
|
|
| |
|
| |
|
|
Weiterführende
Links zum Thema "Global Warming" etc. innerhalb
dieser Website (
nur
kurze Hinweise!): |
|
|
| |
|
 Das zyklische Auftreten von Kalt- und Warmzeiten im Laufe der
Erdgeschichte.
Das zyklische Auftreten von Kalt- und Warmzeiten im Laufe der
Erdgeschichte.
Das zyklische
Auftreten Warm- und Kaltzeiten (150 Mio. Zykluszeit / Eis-Zeitalter)
Das
zyklische Auftreten Warm- und Kaltzeiten (125.000. Zykluszeit
/ Eiszeit-Zyklus)
Klimaschwankungen
im Jungpleistozän und Holozän und Vegetationsgeschichte
Kurzer
Überblick zur Klimageschichte
Literaturangaben
zur Klimageschichte, kleine Auswahl
Globalklimatische
Grundlagen und Entstehung von Vegetationszonen
Die
glaziale und postglaziale Vegetationsgeschichte Afrikas
Postglaziale
aride und humide Phasen in der Sahara Afrikas
Meeresspiegel
während des LGM (120m unter NN) u. Simulation um +5m ü.NN
Glaziale
bis postglaziale Nordseegeschichte
Entwicklung der
Insel Sylt
Holozäne
Optima und Pessima
2000 Jahre
Temperaturentwicklung der nördlichen Hemisphäre, Bemerkungen
zum "Hockeystick"
Sargasso
Sea Surface Temperature (3000 BP - Present)
Der sogenannte
Treibhauseffekt
Hurrikane haben nicht
immer Saison
Elektromagnetisches
Spektrum, Strahlungsenergie und Absorption
Die Bedeutung von
Kohlendioxid
Der Kohlenstoffkreislauf
- Ein kleiner Einblick
Das zyklische
Auftreten von Sonnenzyklen |
|
| |
|
| |
|
 Freundlicher
Hinweis:
Freundlicher
Hinweis:
Wenn Sie Inhalte dieser
Website zitieren oder diskutieren, was sehr erwünscht ist,
bitte verfälschen Sie nicht die Inhalte durch unvollständige
Zitate bzw. reissen Sie die Inhalte nicht aus dem Zusammenhang,
und bitte geben Sie die Quellen richtig und vollständig
an. |
|
| |
|
|
|
|
| |
|
|
|
|
|
|
|